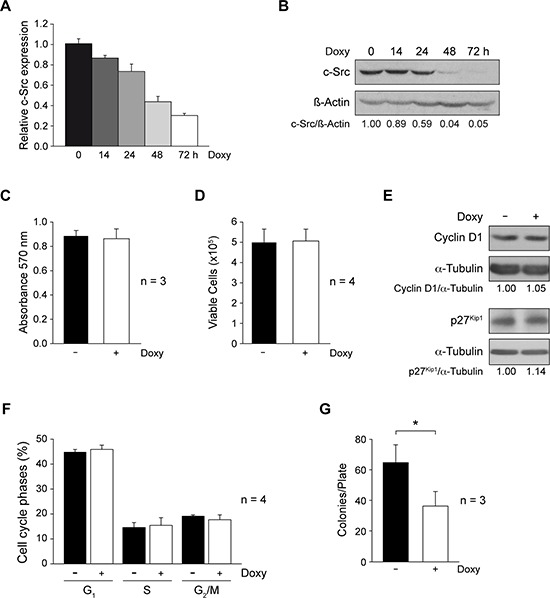
Figure 1. Involvement of c-Src in cell proliferation and anchorage-independent growth of MDA-MB-231-Tet-On-shRNA-c-Src.

A. To analyze c-Src mRNA and protein expression in MDA-MB-231-Tet-On-shRNA-c-Src cells, total RNA and protein were isolated from cells grown with or without Doxy (2 μg/ml) for different times. c-Src mRNA expression was determined by qRT-PCR by a TaqMan assay employing TBP as endogenous control (see Materials and Methods). Results are shown as mean ± SD of relative c-Src mRNA levels in three independent experiments in triplicate, considering arbitrarily the first sample of Doxy-untreated cells triplicate as 1. B. Cell extracts were used to detect c-Src by immunoblotting with MAb-327; membranes were then reblotted with anti-β-actin for loading control. Results are representative of three independent experiments. C. Cells were grown with or without Doxy (2 μg/ml) for 72 h. Metabolic activity was determined by MTT assay measuring absorbance at 570nm. Results are expressed as mean ± SD from three independent experiments in triplicate. D. Cell viability was evaluated counting cells after Trypan blue labeling. Results are shown as mean ± SD from four independent experiments in triplicate. E. Extracts from control and Doxy-treated cells were blotted with Cyclin D1 and p27Kip1 antibodies. Membranes were reblotted with anti-α-tubulin for loading control. Results are representative of three independent experiments. F. Cells were collected fixed with 70% ethanol in PBS at 4°C, washed with PBS and incubated with RNAase and propidium iodide for 1 h at 37°C, cell acquisition was performed with FACScan flow cytometer (BD). Percentages of cell cycle phases (G1, S, G2/M) were calculated from DNA histograms by CellQuest software. Results are shown as mean ± SD from four independent experiments. G. Number of colonies/plate obtained after cell growth in soft-agar (20 days −/+ 2 μg/ml Doxy) (see Material and Methods). Colonies were stained with crystal violet and counted by phase contrast microscopy. Average ± SD from three independent experiments in triplicate (*p < 0.05).
