
Figure 9. GD55 induced cell death in vivo.
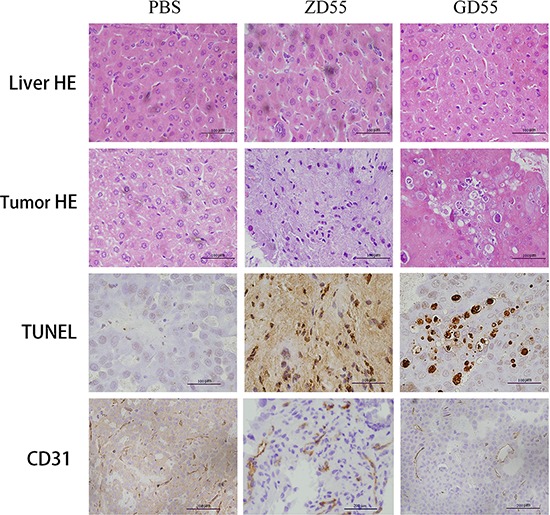
Histological analysis of tumor sections in GD55, ZD55, and PBS groups for Huh7 tumor xenograft. The upper two rows are hematoxylin and eosin staining analysis for animal liver and tumor tissues, indicating that hepatotoxicity or cell necrotic area in tumors. The third row is TUNEL assay for detecting apoptotic cells in tumor tissues. GD55 induced more apoptosis of tumor cells. The brown color represents the apoptotic cells. The bottom row showed the immunohistochemical staining for vessel marker CD31, indicating that vessel growth in tumors treated with GD55 was significantly suppressed compared with the control-treated groups. Original magnification: × 200.