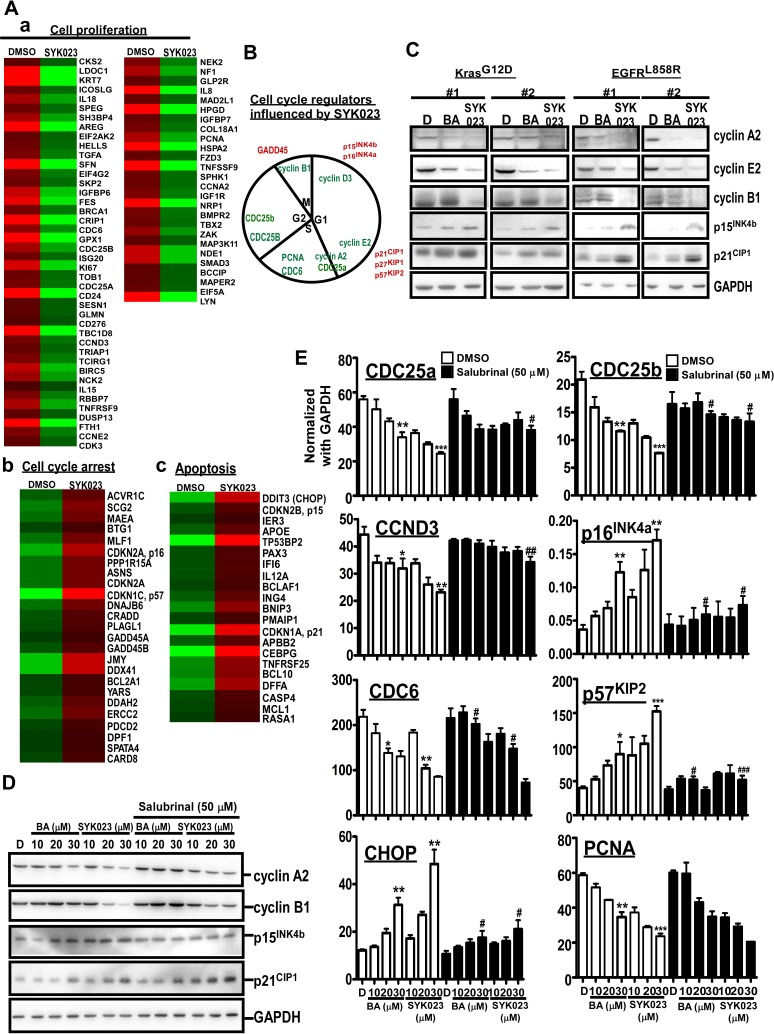
Figure 4. Gene expression profile altered by SYK023-induced ER stress.
A. Micorarray analysis of DMSO- and SYK023 (20 μM)-treated cells. B. Cell cycle regulators affected by SYK023 were summarized. Red is upregulation, and green is downregulation. C. Upper panel, lysates of lungs were analyzed by Western blotting. Lower panel is quantitated results. D. Upper panel, whole cell lysates of H1299 were prepared for Western blotting. Lower panel panel is quantitated results. E. The mRNA was analyzed by Q-PCR using indicated primers. Data are expressed as mean±s.e.m. Compared with DMSO without SAL: *P < 0.05, **P < 0.01 and ***P < 0.001. The comparison between groups with or without SAL: #P < 0.05, #P < 0.01 and #P < 0.001.

