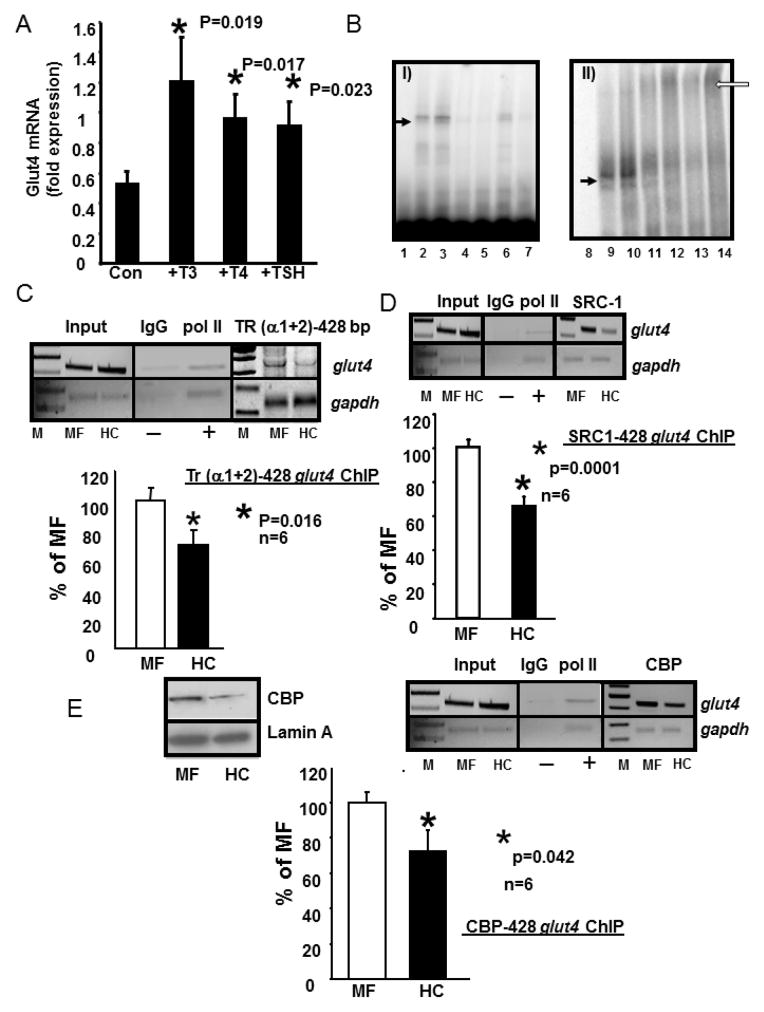
Figure 3.
A. Induction of Glut4 mRNA by T3, T4 and TSH treatment in C2C12 murine skeletal muscle cells.
C2C12 cells were treated with nothing (Con) or T3 (10−7M), T4 (10−7M) and TSH (5 mIU/ml) for 6 h. RT-qPCR generated CT values were normalized to that of gapdh, and expressed in arbitrary units. Data are expressed as the mean±SEM of triplicate independent determinations (n=3 each).*denotes statistical difference between the treatment and the Con group, with p values shown in the figure. B. Electromobility shift (EMSA) and supershift (EMSSA) assays. Panel I: Representative polyacrylamide gel demonstrating no gel-shift in the absence of nuclear extracts with only the free 32P-end-labeled DNA probe (lane 1 = free probe, FP) that spans the glut4 gene containing the TRE-binding site, A gel-shifted band (solid arrow) is seen with the labeled glut4 DNA probe in the presence of skeletal muscle nuclear extracts obtained from MF (lane 2) or HC (lane3). This gel-shift (solid arrow) is competed by increasing concentrations (50x in lanes 4 and 6; 500x in lanes 5 and7) of the unlabeled oligoprobe. Panel II: Representative polyacrylamide gel demonstrates supershifted band (open arrow) only in the presence of anti-TR IgG (lanes 11 and 12 are MF and HC incubated for 2hr; lanes 13 and14 are MF and HC when incubated overnight). Free probe alone = lane 8 and free probe with nuclear extracts from MF and HC respectively demonstrate a gel-shift (solid arrow) but no supershift in lanes 9 and 10. C., D., E. Chromatin immunoprecipitation (ChIP) assay demonstrating TR-, SRC-1-, CBP-glut4 interaction. Top panel depicts representative 2% agarose gels demonstrating the input chromatin PCR-amplified glut4 and gapdh control without an antibody (left panels), in the presence of nonspecific (IgG, −) and anti-polymerase II (pol II, +) IgGs (middle panels), and ChIP assay demonstrating the PCR amplified 428 bp fragment containing the glut4 DNA (top gels) or 230 bp fragment with the gapdh DNA (internal control, bottom gels) from 100d old male MF and HC skeletal muscle in the presence of anti-TR (α1+2) (C), SRC-1 (D) or CBP (E) IgGs (respective right panels). In addition, left top panel (E) demonstrates representative Western blots showing nuclear CBP (top gels) and lamin A (nuclear internal loading control; bottom gels) protein concentrations in 100 day old male MF and HC skeletal muscle. Bottom panels depict quantification (qPCR) of the 428 bp glut4 amplification product from the TR (C), SRC-1 (D) or CBP (E) ChIP as a ratio to that of the respective gapdh DNA product after correction for the input control and expressed as a percent of MF. M = DNA size markers, *p=0.016 (C), *p=0.0001 (D), *p=0.042, (E) with n=6 samples for each protein and in each experimental group.

