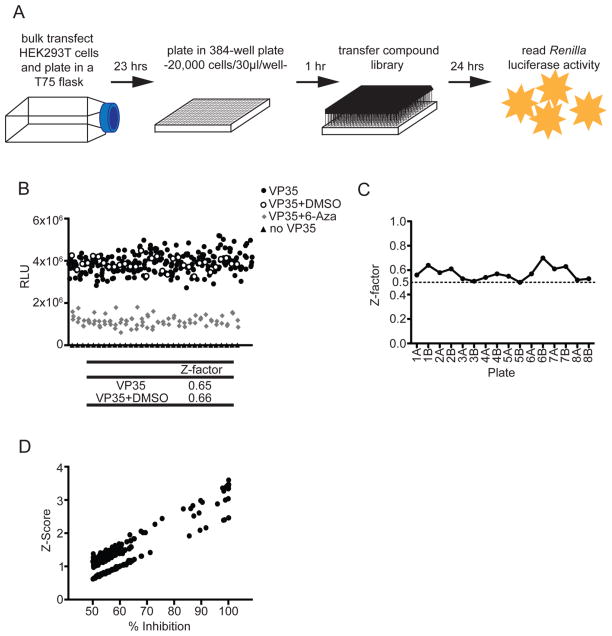
Figure 2.
High-throughput screen for identifying EBOV RNA synthesis inhibitors. (A) Schematic diagram of EBOV minigenome HTS assay. HEK293T cells were transfected in bulk in a T75 flask. Twenty-four hours post-transfection cells were plated in a 384-well plate and allowed to rest for 1 h, after which the compound library was transferred via pin tool (final concentration = 7–7.7 μM). Twenty-four hours following compound addition Renilla luciferase activity was measured. (B) A quality control plate was used to assess the effects of DMSO and the efficiency of pin tool transfer prior to the screen. Twenty-four hours post-transfection cells were plated in 384-well format. DMSO (final concentration = 0.07%) was added via pin tool transfer, and 6-azauridine (6-Aza) (final concentration = 7 μM) was added using an HP D300 digital dispenser. Twenty-four hours post-treatment luciferase activity was assessed, and Z-factor values were calculated using the formula Z-factor = 1 − [(3σc+ + 3σc−)/(|μc+ − μc−|)]. No VP35, black triangles, 32 wells; VP35, black circles, 240 wells; VP35+DMSO, open circles, 32 wells; VP35 + 6-Aza, gray diamonds, 80 wells. (C) Z-Factor values were calculated from the controls on each plate in the screen of known bioactive compounds. Duplicate plates are designated A and B (i.e., duplicates of library plate 1 are 1A and 1B). (D) Z-Scores and percent inhibitions were calculated for each compound (two replicates), and those with inhibition ≥50% were plotted against their Z-score.

