Fig. 1.

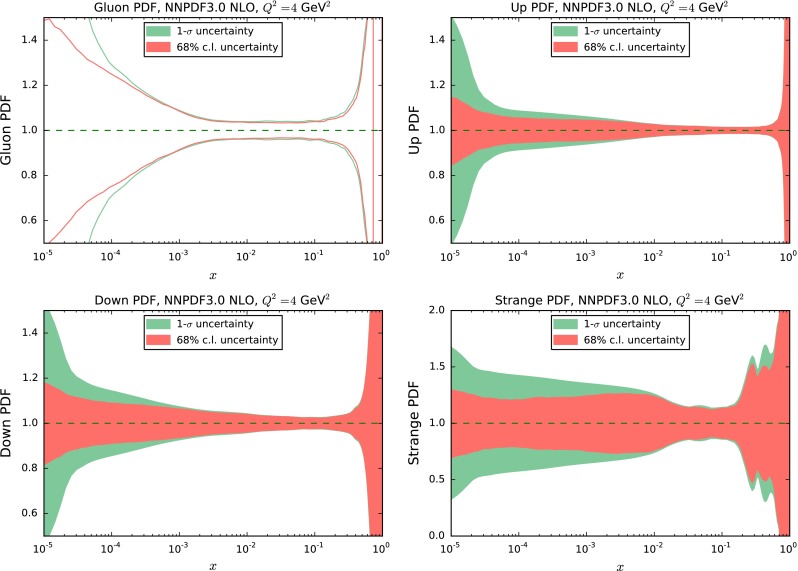
Comparison of one-sigma and 68 % confidence level intervals for some PDFs from the NNPDF3.0 NLO set, determined using a sample of MC replicas, at GeV. From top to bottom and from left to right the gluon, down, up and strange PDFs are shown

Comparison of one-sigma and 68 % confidence level intervals for some PDFs from the NNPDF3.0 NLO set, determined using a sample of MC replicas, at GeV. From top to bottom and from left to right the gluon, down, up and strange PDFs are shown