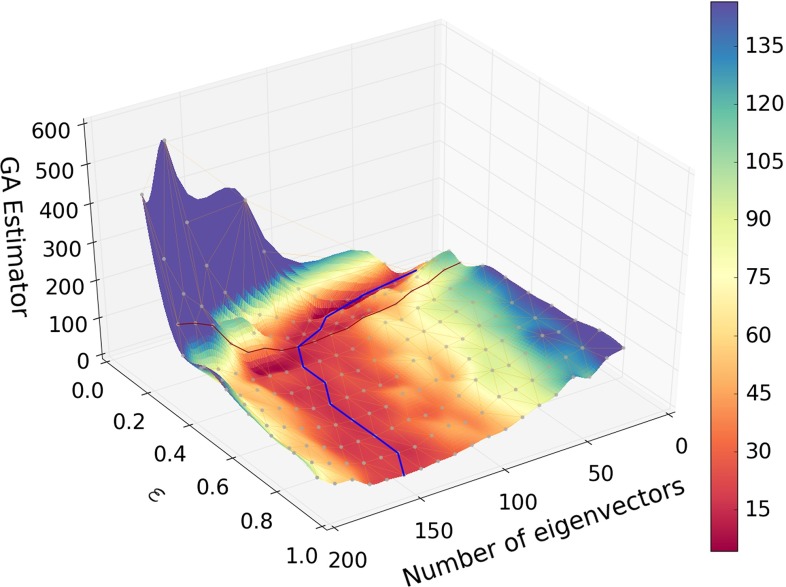
Fig. 2.
The figure of merit, Eq. (13), for the Hessian representation of the NNPDF3.0 NLO set, computed for points which satisfy the gaussianity criterion Eq. (12), plotted versus the threshold Eq. (12) and the number of eigenvectors , after the choice of basis replicas has been optimized through a run of the GA with the settings of Table 1. The value of the estimator along the valley of minima, i.e. the curve determined by finding the value of at which the estimator has its absolute minimum for each is shown (blue curve). The red curve marks the value which is finally adopted. The projection of the valley of minima in the plane is shown in Fig. 3

