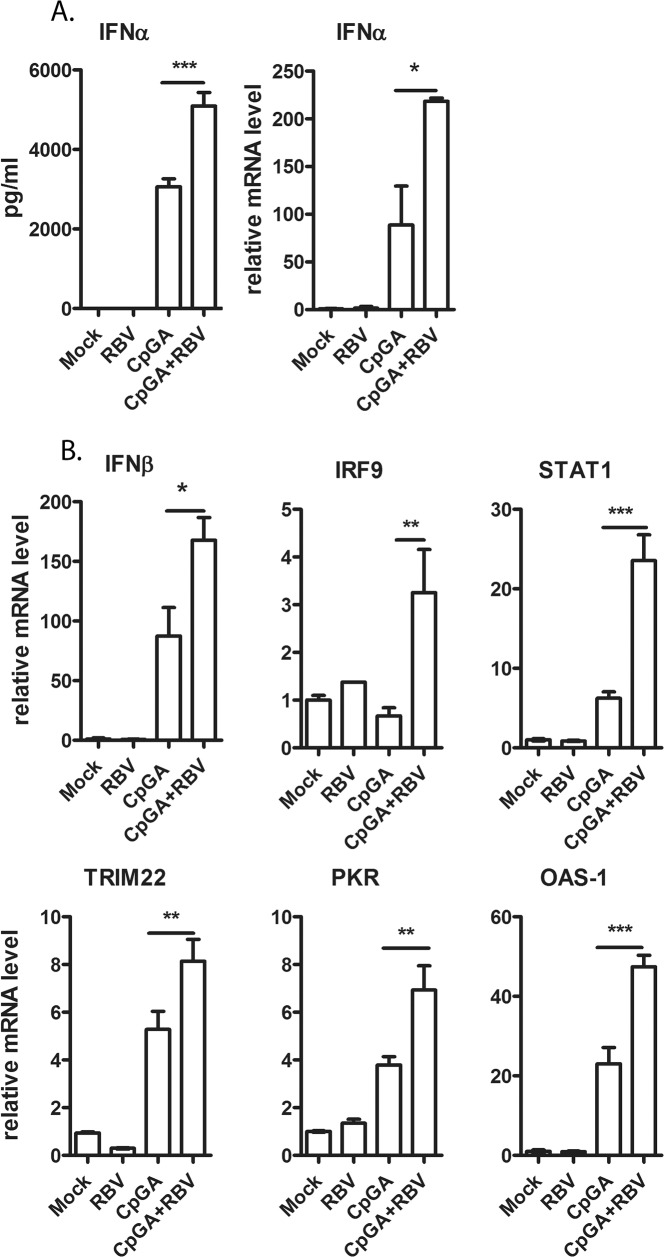
Fig 3. Expression of interferon-stimulated genes in CpGA and RBV treated pDC-Gen2.2.
(A) Comparison of IFNα protein and mRNA levels in sample treated with CpGA and CpGA+RBV. Induction of IFNα was measured by ELISA or qRT-PCR, respectively at 16 hpt. (B) Induction of ISG expression in CpGA+/-RBV treated pDC-Gen2.2. ISG mRNA abundance was measured by qRT-PCR at 16hpt. The values are shown as mean with SD. One-way analysis of variance (ANOVA), followed by Bonferroni’s multiple-comparison test was used to compare between treatment groups. *p≤0.05; **p≤0.01; ***p≤0.001.

