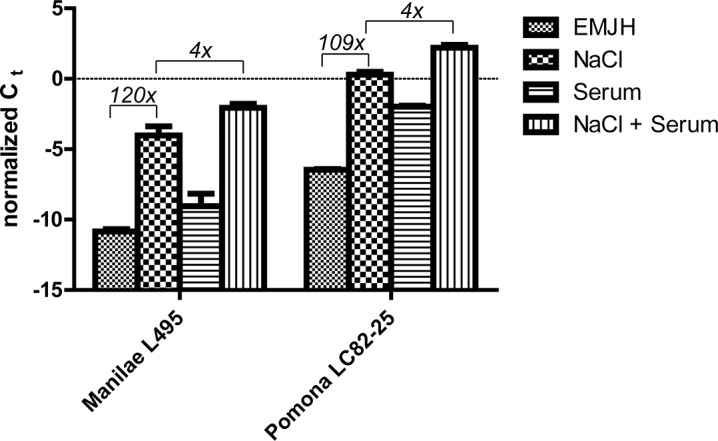
Fig 4. Effect of salt and serum on sph2 transcript levels in L. interrogans.

Transcript levels were determined by quantitative RT-PCR. Ct values for sph2 transcript were normalized to those for lipL41 transcript. Fold differences between growth conditions are shown in italics. Mean and standard deviation from three biological replicates are shown; p < 0.001 for all group comparisons (one-way ANOVA, Tukey multiple comparisons post-test).
