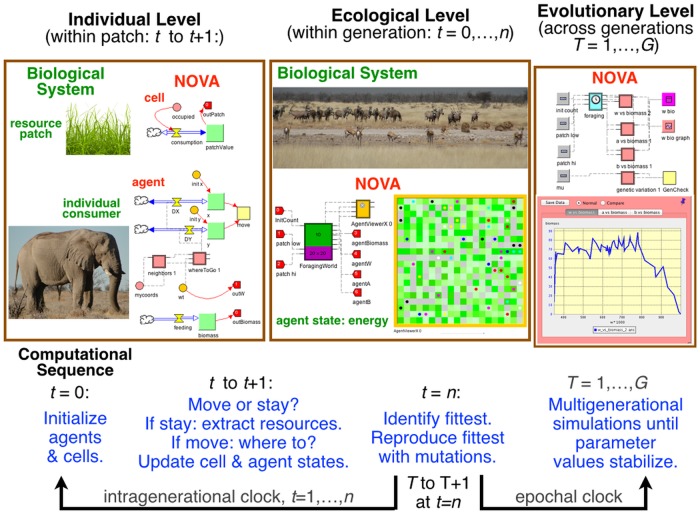
Fig 2.
Left hand panel: individual level processes controlling the replenishment of resource patches and the growth (biomass) of individuals, through extraction of resources from these patches, are depicted using graphical Nova elements. Central panel: ecological level process managed by a Nova simworld aggregator are graphically depicted, with consumers either foraging within patches or moving from patch-to-patch during each tick of the intragenerational clock. The progeny of the fittest individuals (i.e., greatest biomass at t = n) inherit perturbed (mutational process) parameter values from one (clonal reproduction) or two (sexual reproduction) parents at the end of each generation. Right panel: the evolutionary level process, represented by changes to the parameter values of individuals (i.e., genotypes and corresponding phenotypes), is monitored by the epochal clock that runs the evolutionary algorithm for G generations. (See S1 Text for discussion of Nova platform).

