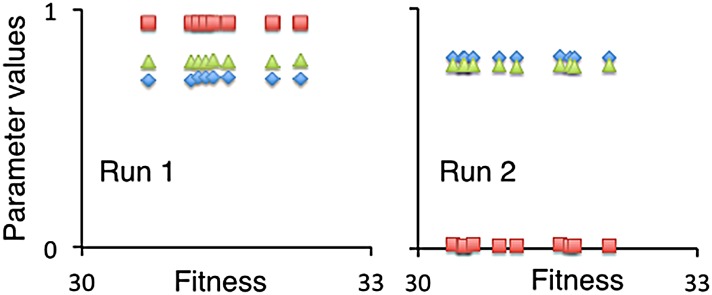
Fig 3. Evolved values of parameters (introduced in the Moore neighborhood movement section above).

The left and right panels are the result from two different 10-agent runs using the same baseline data (Table 2). Parameter values for each of the ten agents in the final generation (T = 200) are plotted as a function of their fitnesses (ranging from 30 to 33). The evolved neighbor-discount parameter α (green triangles), competition-tradeoff parameter δ (red squares), and movement-threshold parameter ρ (blue diamonds), across the 10 agents differ, in the two runs; but yield similar fitness distributions, although the left panel shows a little more chance variance than the right.
