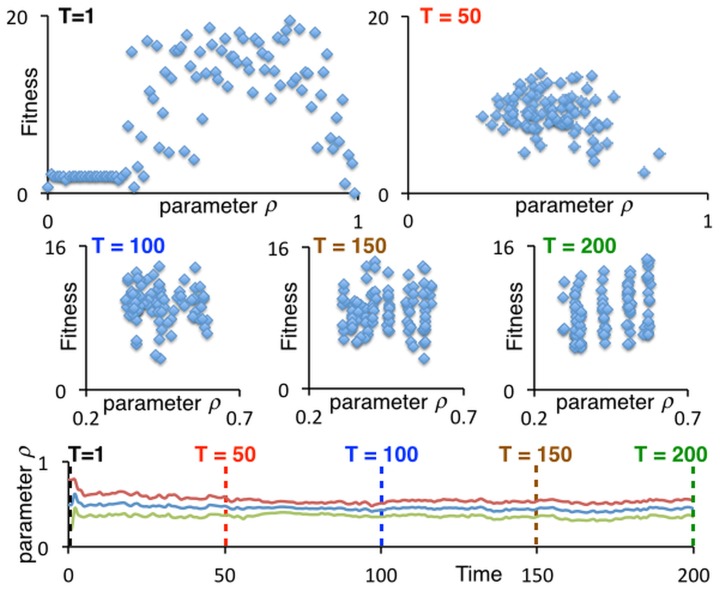
Fig 5. Evolution of the movement-threshold value ρ.
The five scatter graphs (top two rows) represents snapshots over a particular 200-generation (T), 100-agent run of the parameter values ρ at times T = 1,50,100,150 and 200. The lower panel depicts the mean plus/minus the standard deviation of the values of ρ for the 100 agents over the interval 0 ≤ T ≤ 200.

