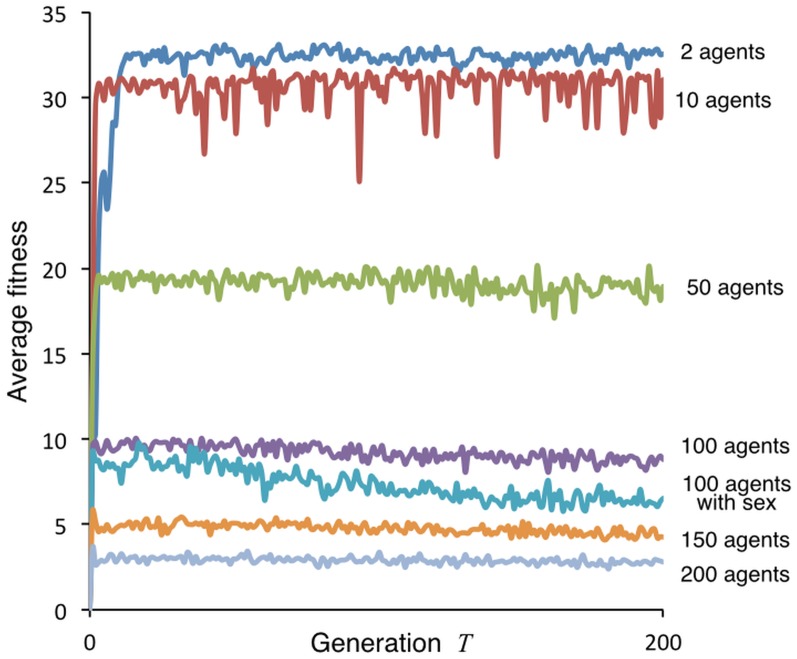
Fig 7. Time course of average fitness.
(i.e., final biomass B a(n) among N A agents). The average fitness is plotted over T = 1,…,200 generations for illustrative runs with the following number of clonal reproducing individuals, except for one sexually reproducing group, as indicated: 2 (blue), 10 (red), 50 (green), 100 (purple), 100 with sexual reproduction (turquoise), 150 (orange) and 200 (grey) agents.

