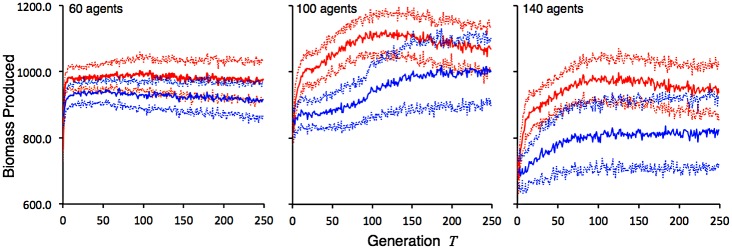
Fig 8. Evolving biomass production efficiency of guilds.

Total biomass produced per generation (solid lines are averages over n runs, dotted lines are plus and minus one standard deviation) under clonal reproduction (red) and random mating (blue), by evolving guilds over 250 generations of, respectively from left to right, 60 (n = 50), 100 (n = 50), and 140 agent (n = 50) guilds of foragers. For a reference to these data see S4 Text.
