Figure 2.
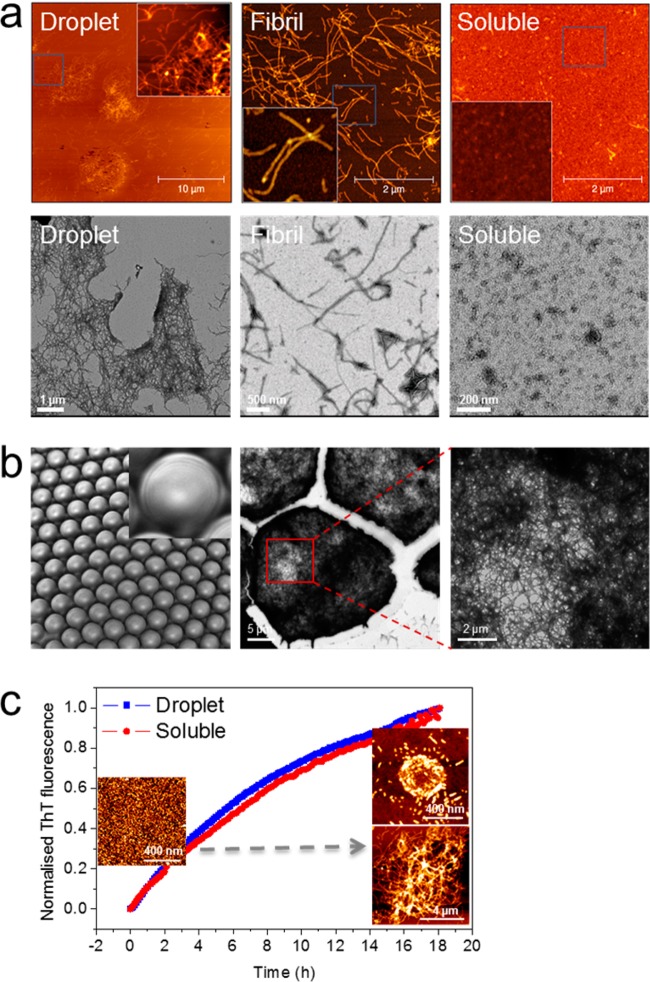
Microgel formation of Ure2-AP. (a) Analysis of Ure2-AP aggregates by AFM (upper panels) and negative stain TEM (lower panels). Ure2-AP droplet fragments (left panels) show a dense mesh-like network formed of amyloid fibrils similar to the individual fibrils formed in bulk solution (middle panels), whereas soluble Ure2-AP before incubation to form fibrils contains only small aggregates (right panels). (Insets) Enlarged scanning of boxed area in each AFM image. The scale bars are as indicated. (b) Droplets of Ure2-AP solution were formed as shown in Figure 1. Uniformity of the resulting droplets observed using light microscopy (left panel). Droplets were incubated to allow microgel formation (see Figure 1) and then intact droplets were added directly onto a nondischarged carbon-coated grid, stained, and imaged by TEM. Negatively stained droplets could be observed (middle panel), containing a dense network of amyloid fibrils within each droplet (right panel). (c) The kinetics of fibril assembly for encapsulated Ure2-AP and for Ure2-AP in bulk solution were monitored by ThT binding fluorescence. (Insets) AFM images demonstrate the conversion of droplet-encapsulated Ure2-AP from the soluble to the fibrillar state. The scale bars are as indicated.

