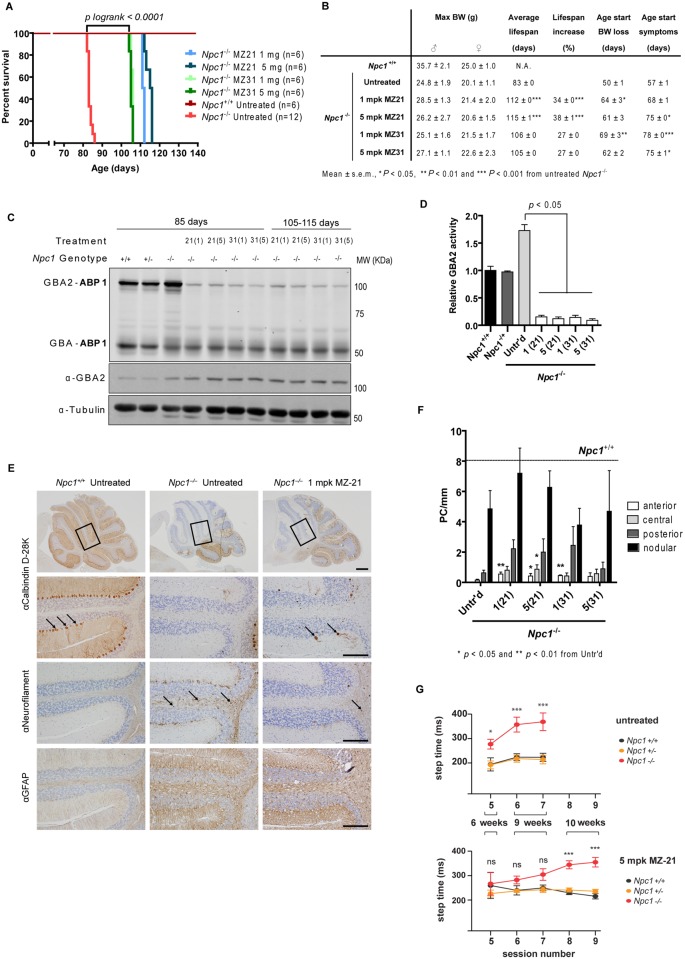
Fig 3. Pharmacological inhibition of GBA2 in Npc1 -/- (BALB/c) mice.
(A) Kaplan-Meier survival plots of Npc1 -/- mice treated with 1 and 5 mg/kg.bw/day (mpk) of MZ-21 and MZ-31 (P logrank < 0.0001 from untreated Npc1 -/- mice). (B) Maximal bodyweight, average lifespan, percentage lifespan increase and age at which bodyweight loss and neurological symptoms are patent in Npc1 +/+ and Npc1 -/- treated and untreated mice. (C) Fluorescent labelling of GBA and GBA2 with ABP 1 and immunostaining with anti-GBA2 and -tubulin antibodies in brain homogenates of Npc1 +/+, Npc1 +/- and Npc1 -/- treated and untreated 85- and 110-day-old mice. (D) GBA2 activity (assayed with 4MU-β-D-Glc substrate) in brain homogenates of Npc1 +/+, Npc1 +/- and Npc1 -/- treated and untreated 85-day-old mice relative to Npc1 +/+ (wt) values. (E) Sagittal cerebellar sections of 85-days-old Npc1 +/+ and Npc1 -/- treated and untreated immunostainned with antibodies against calbindin D-28K, neurofilament and GFAP. The arrows indicate calbindin D-28K positive cells (2nd panel from top) and swollen axons positive for neurofilament (3rd panel). Scale bar = 500 μm (top-panel) and 200 μm (other panels). (F) PC count in the anterior, central, posterior and flocculonodular areas of the cerebellum of Npc1 -/- treated and untreated 85-day-old mice. The line indicates Npc1 +/+ levels. (G) Motor coordination of untreated and treated Npc1 -/- mice measured in the Erasmus Ladder. Step time (in ms) during perturbed sessions of Npc1 +/+, Npc1 +/- and Npc1 -/- untreated (top) and treated (bottom) mice at six (session 5), nine (sessions 6 & 7) and ten (sessions 8 & 9) weeks of age. Data (n = 4–12 per group, mean ± s.e.m.) were analyzed using the Kruskal-Wallis test with post hoc Dunn’s multiple comparison test: * P < 0.05; ** P < 0.01; *** P < 0.001.

