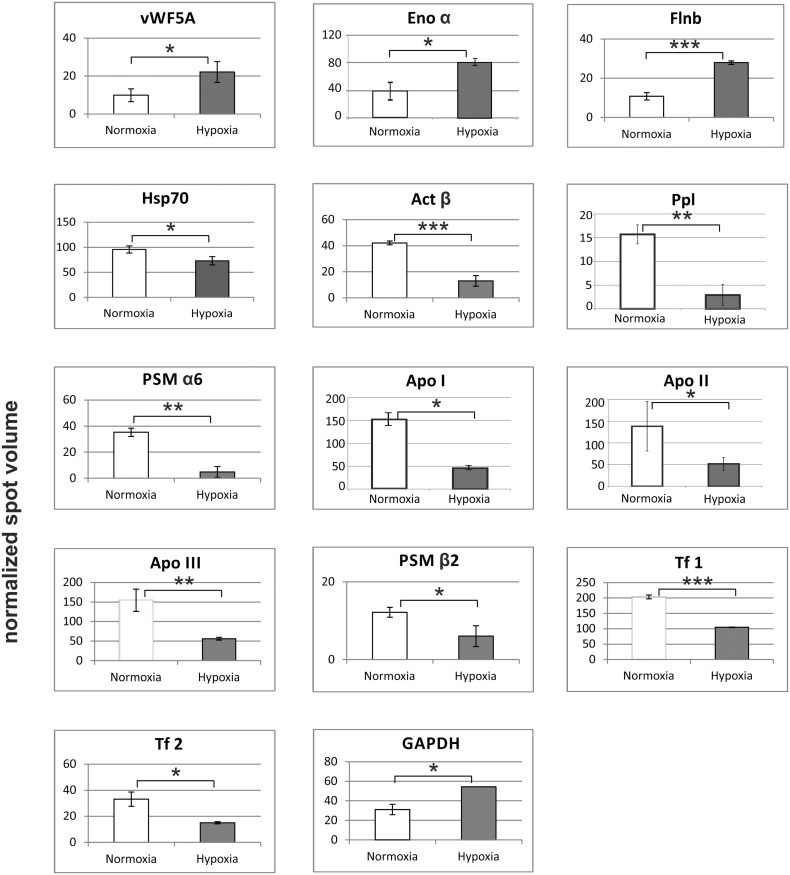
Fig 5. Changes in the protein level in the gills of the European flounder in response to hypoxia.
Protein spot volumes were normalized according to GAPDH. Protein expression changes were calculated by the comparison of the mean of hypoxia (n = 3) to normoxia (n = 3) ± s.d., and significance levels were determined by a Student's t-test on the log2 transformed values; * = p< 0.1; ** = p< 0.01; *** = p< 0.001. For detailed information see S7 Table.

