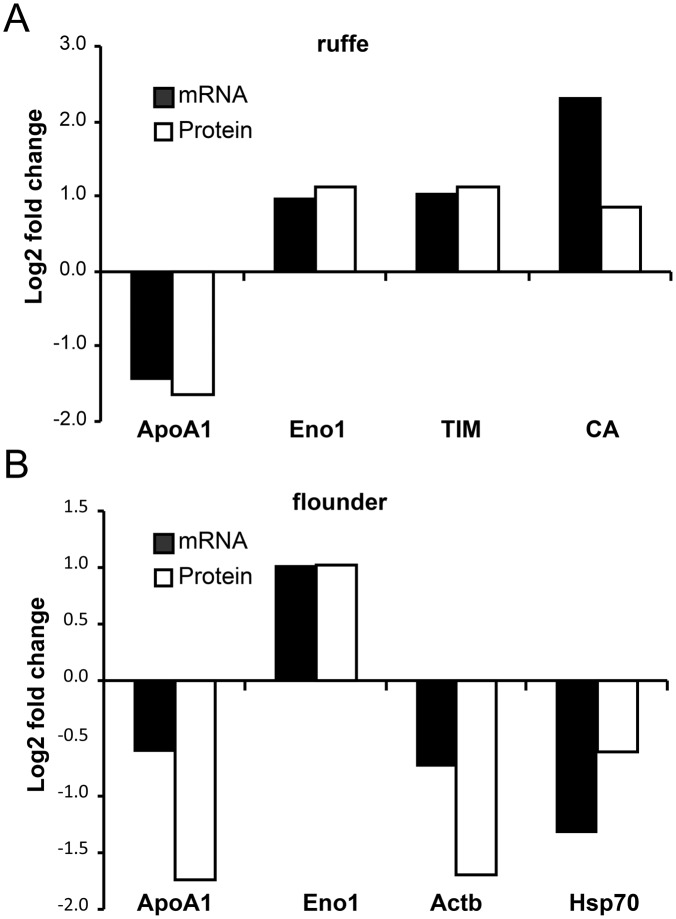
Fig 6. Comparison of the changes in protein and mRNA levels in the gills of ruffe (A) and flounder (B).
Changes in protein levels were calculated as stated above (see Figs 4 and 5). mRNA copy numbers were measured by qRT-PCR (n = 3). The data are presented as log2 fold changes. The raw qRT-PCR data are provided in S8 table, the standard deviations for the proteins are given in S6 and S7 tables. A scatter plot that compares the changes of protein and mRNA levels is provided as S2 Fig.

