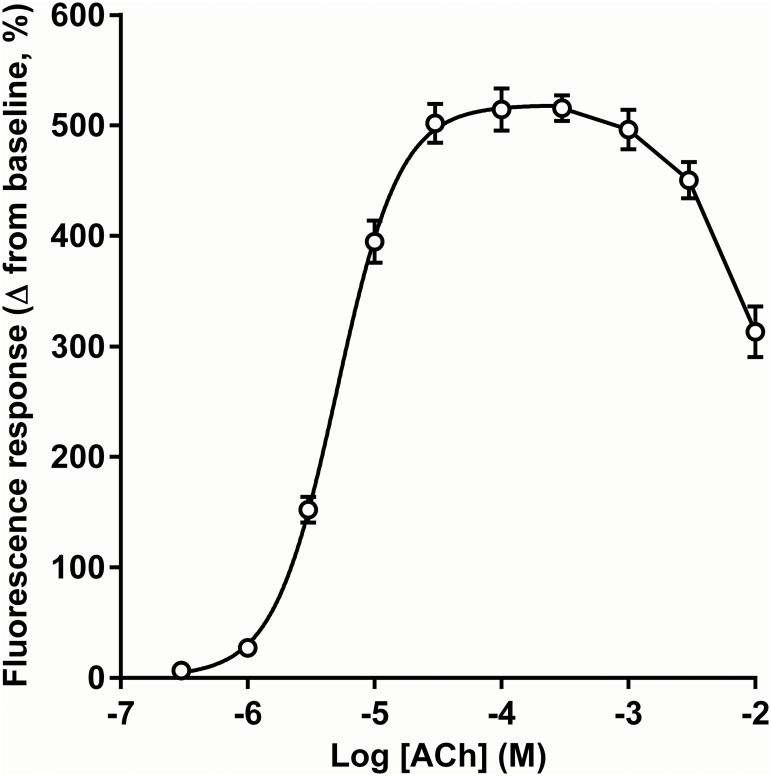
Fig 2. Concentration-response relationship for ACh in CN21 cells.
This graph shows the effect of ACh (in the presence of 20 μM atropine) on the fluorescence response measured in CN21 cells. Data are displayed as the mean ± SEM of four replicates on a single plate. The sigmoidal concentration-response curve was fitted for concentrations between 3 x 10⁻⁷ and 3 x 10⁻⁴ M. Best fit values: EC50 = 5.0 × 10⁻⁶ M; Log EC50 = -5.3; Hill slope = 1.7

