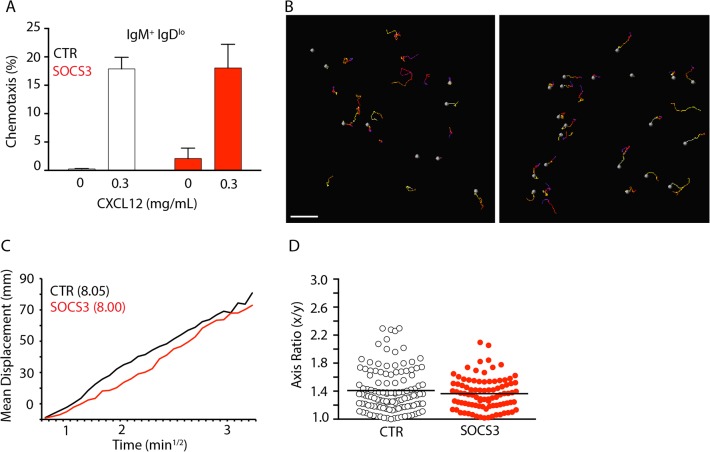
Fig 4. CXCR4-mediated B-lineage cell migration is independent of SOCS3 signaling.
A, Transwell migration assay of immature B cells from Socs3 fl/fl (SOCS3, red) or Socs3 +/+ (CTR, white) Mb1 Cre/+ mice towards CXCL12 in vitro. Bars indicate average and standard deviation. B, Distribution of GFP+ B lineage cells in BM of Socs3 fl/fl Mb1 Cre/+ mice (left) and Socs3 +/+ Mb1 Cre/+ (right) mice. Movement of GFP+ cells tracked for 30 minutes. Colored lines depict cell trajectories over time. Scale bar is 50 μm. C, Mean motility coefficient of B-lineage cells from Socs3 fl/fl Mb1 Cre/+ mice (red) and Socs3 +/+ Mb1 Cre/+ (black) mice. Cell displacement from starting coordinates is plotted against the square root of time. D, Measurement of cell axis ratio of GFP+ B lineage cells from Socs3 fl/fl Mb1 Cre/+ mice (red) and Socs3 +/+ Mb1 Cre/+ (black) mice. Lines indicate mean, circles depict individual cells analyzed.

