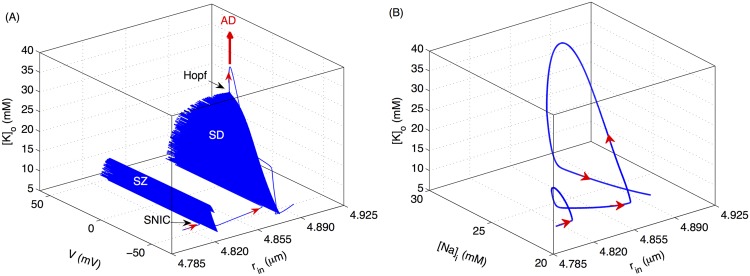
Fig 2. Transition of the cell from SZ to SD due to cell swelling.
(A) Changes in membrane potential, [K]o, and r in of the cell as it transitions from SZ to SD. (B) is from the same simulations as in (A) with the horizontal axis representing [Na]i instead of V. The thick arrow indicates that for higher [K]o, whether due to higher K + exposure or hypoxia, the cell exhibits physiological AD as demonstrated below. Simulations based on the full model.

