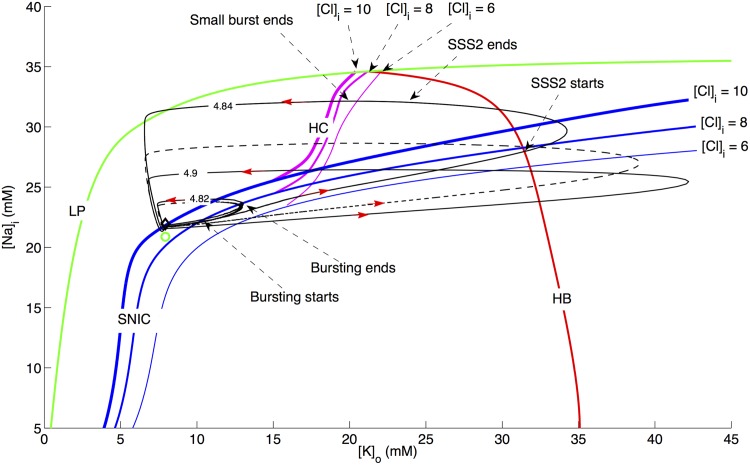
Fig 6. Two-parameter bifurcation diagram.
The locations of HB (red), SNIC (blue), HC (pink), and LP (green) with [K]o and [Na]i as bifurcation parameters for three different [Cl]i values and normal [O]2 of 30 mg/L. The locations of SNIC and HC change with intracellular Cl − as shown for [Cl]i = 6mM, 8mM, and 10mM where the thickness of the blue and pink lines represents increasing [Cl]i value. The position of HB and LP does not change significantly and is therefore only shown for [Cl]i = 8mM. The three solid black traces represent the limit cycles from the full model (Eqs 1, 3, 5, 7, 10), and fixed volume) for three r in values shown in the figure in μm and correspond to the three behaviors in Fig 1C (with slightly larger rin), Fig 1D and 1E respectively. The red arrows show the direction of trajectories. The diamond and small circle represent steady states at r in = 4.6μm and 4.95μm respectively. The black dashed curve is a 2D version of Fig 2B and is shown for comparison.

