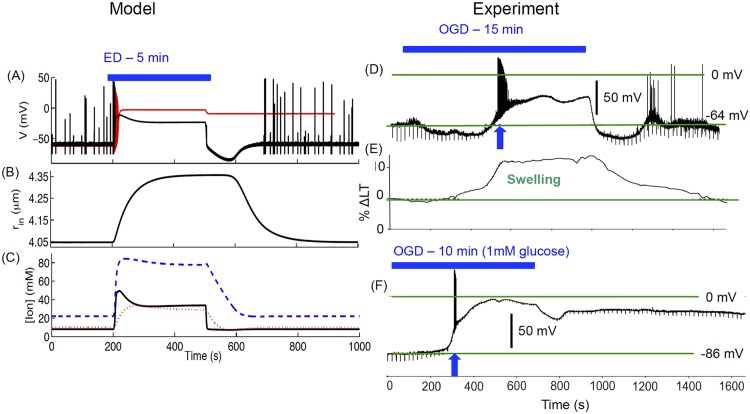
Fig 7. Model cell response to energy deprivation (ED, the model-equivalent of OGD).
The cell exhibits AD in response to 5 min ED and returns back to normal behavior after ED ends (A). Change in cell radius (B) and ion concentrations (C) during ED. Solid, dashed, and dotted lines in (C) represent [K]o, [Na]i, and [Cl]i respectively. The black line in (A) and all lines in (B, C) correspond to initial r in = 4μm, while the red line in (A) is for initial r in = 3μm. (D) shows experimental membrane potential of a magnocellular neuroendocrine cell (MNC) under 15 min OGD. Panel (E) shows the percent change in light transmittance (ΔLT) representing cell swelling, while (F) shows AD exhibited by a pyramidal neuron in neucortical layer V. (D-F) Data provided by David Andrew. (D-F) modified from [20] with permission American Physiological Society. Simulations based on the full model.

