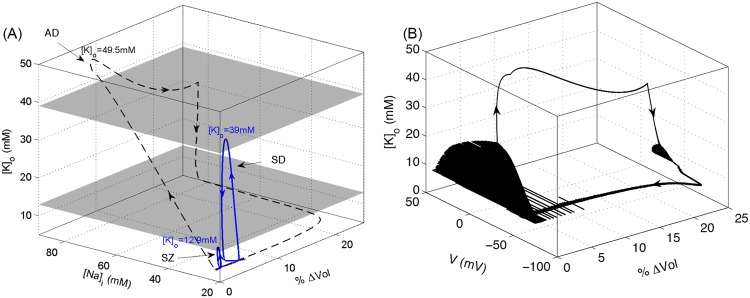
Fig 9. A comparison of microenvironmental changes during SZ, SD, and AD.
(A) Solid and dashed lines represent the simulations in Figs (2) and (7) respectively. %ΔVol represents the percent change in volume and is defined as , where r in,ss and r in,ins represent initial steady state (ss) and instantaneous (ins) radius of the cell respectively. The peak [K]o values during SZ, SD, and AD are shown for comparison. The lower grey plane corresponds to the physiological ceiling for [K]o [42], here calculated at 12.9 mM in the model, whereas the upper plane, which separates SD from AD, is found at 39 mM [K]o. (B) is from the same simulations as shown by the dashed line in (A) and shows the change in membrane potential along with [K]o and volume. Simulations based on the full model.

