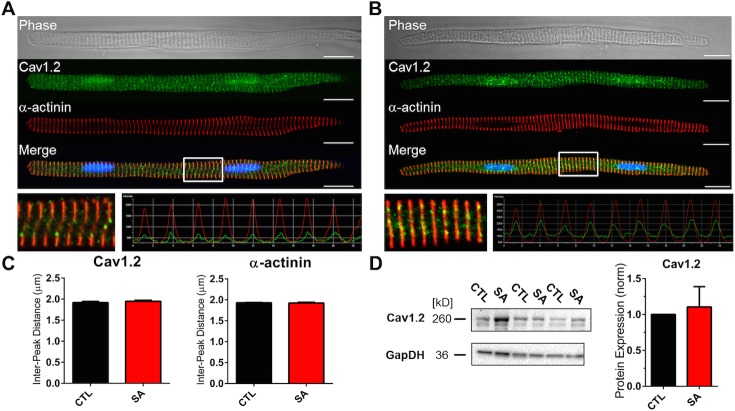
Fig 4. Cav1.2 Localization and whole cell protein content is not affected by stearic acid.
Transmitted light image of an atrial myocyte (top), Cav1.2 protein staining (green), α-actinin staining (red) and a merged image of Cav1.2, α-actinin and DAPI staining (bottom) under control (CTL; Panel A) and following incubation in stearic acid (SA; Panel B). Inset: 20 μm section of the merged image and corresponding intensity profile of Cav1.2 and α-actinin. Scale bars 20 μm. Panel C: Quantification of the intensity profiles shows SA did not alter the mean distance between intensity peaks for Cav1.2 (left) or α-actinin (right; n = 12, 12). Panel D: (left) Western blot for Cav1.2, with GAPDH as a control. Pane D: (right) normalized densitometry plot of Cav1.2 protein levels in CTL and SA treated cell lysates (n = 3).

