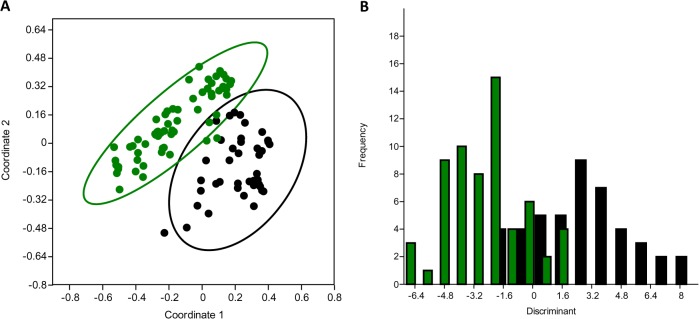
Fig 1. Statistical analysis of phenotypic and genotypic data.

Principal Coordinates Analysis (PCoA) of S. epidermidis (A) from Ocular Infection (OI, green) and isolates from healthy conjunctiva (HC, black). The circles represent the confidence interval 95%. The first two coordinate axes represent 31% of the variance. Discriminant analysis (B) of the isolates of S. epidermidis from Ocular Infection (OI, green) and healthy conjunctiva (HC, black). Negative values belong to OI isolates and positive to HC isolates. The discriminant function properly allocated to 77% of isolates from HC and 84% from OI.
