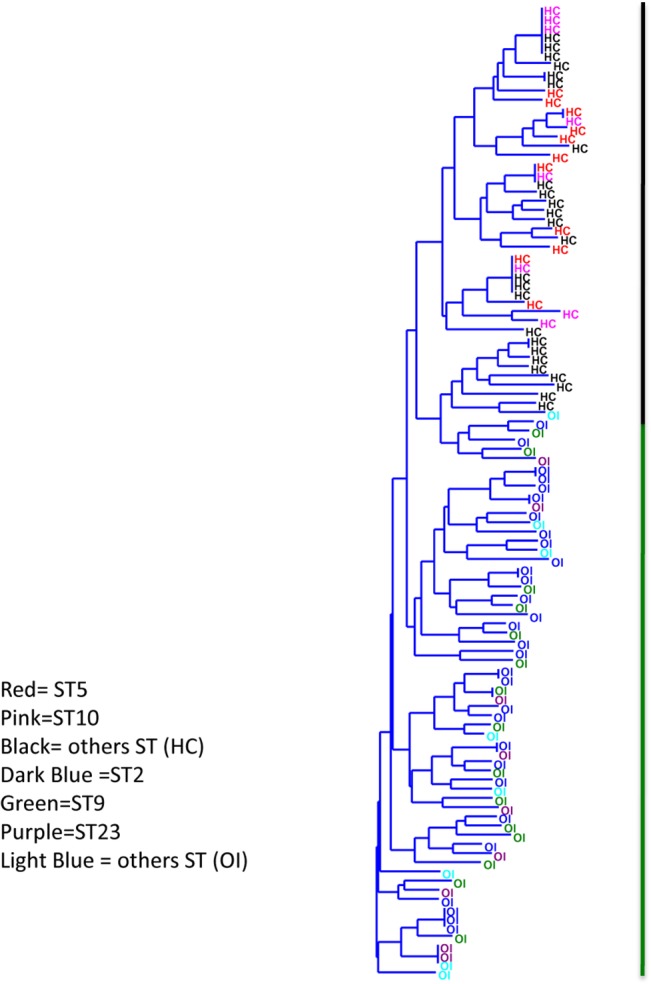
Fig 2. Cluster analyses of the isolates from Ocular Infection and healthy conjunctiva.

The colors represent the ST's. The black vertical line represents the isolates from healthy conjunctiva (HC) and green vertical line isolates from ocular infection (OI).
