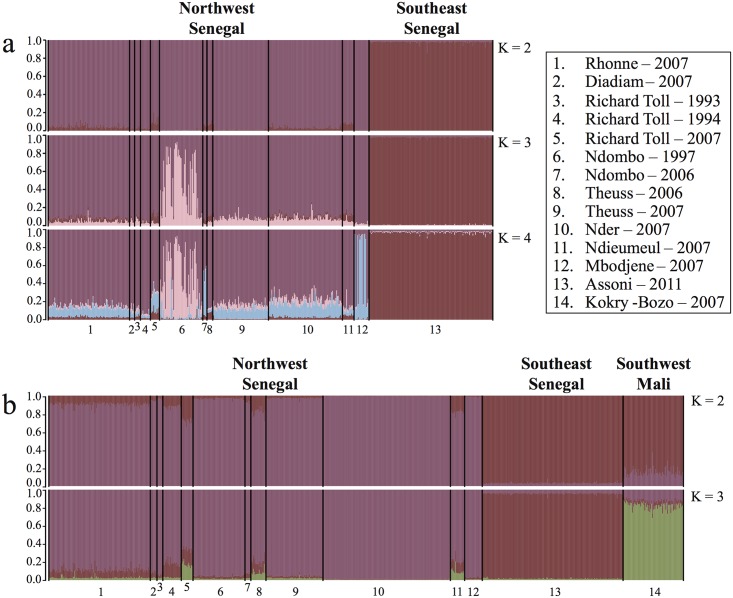
Fig 3. Bayesian clustering analysis with STRUCTURE using microsatellite markers.
Each barplot shows the probability on the y-axis (0.0–1.0) of an individual parasite being assigned to a given number of clusters K (K = 2, 3 or 4) for microsatellite dataset DMS1 (a) and DMS2 (b). Individual parasites are aligned along the x-axis, and grouped according to the location and year of sampling (1–14). Parasites are assigned either to one cluster (each cluster is represented by a different color) or to multiple clusters if their genotypes were admixed (indicated by multiple colors). The optimal K—value (K = 4 for DMS1 and K = 3 for DMS2) was determined by the maximum LnP(D), which is the log likelihood of the observed genotype distribution in K clusters.

