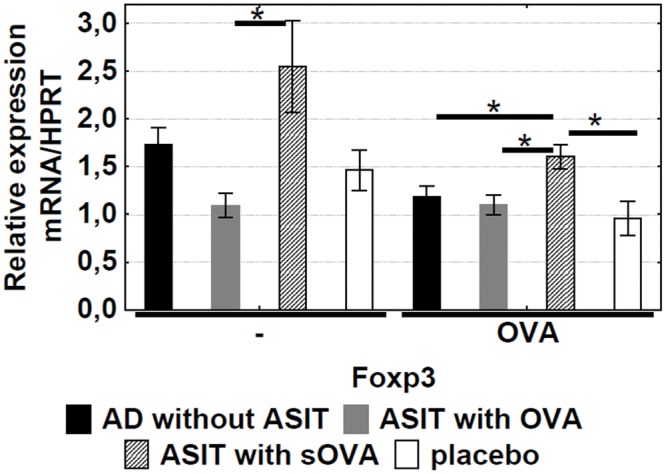
Fig 5. Level of Foxp3 expression.

The specific mRNAs in OVA-stimulated mice splenocytes (incubated with OVA for 72hrs) were quantified by qRT-PCR. The results are presented as mean mRNA expression (mean±SE, n = 8 for each). The relative levels of Foxp3 expression were calculated by referring to the HPRT (hypoxanthine guanine phosphoribosyltransferase) in each sample. AD without ASIT: OVA-sensitized untreated mice; ASIT with OVA: OVA-sensitized mice treated by ASIT with OVA; ASIT with sOVA: OVA-sensitized mice treated by ASIT with sOVA; placebo: PBS-sensitized mice. *, p<0.05.
