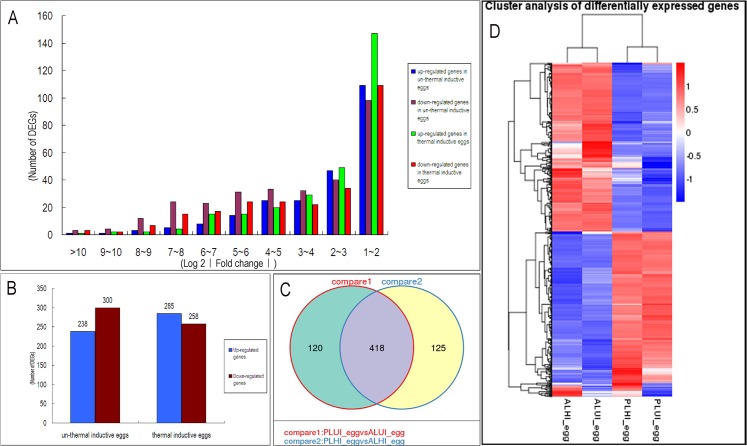
Fig 3. Bioinformatic analysis of DEGs.
(A) The fold-change distribution of DEGs. (B) Number of up-regulated and down-regulated genes in non-induced and thermally induced eggs. (C) Venn diagrams showing the number of DEGs between the two lines before and after thermal induction. (D) Cluster analysis of DEGs.

