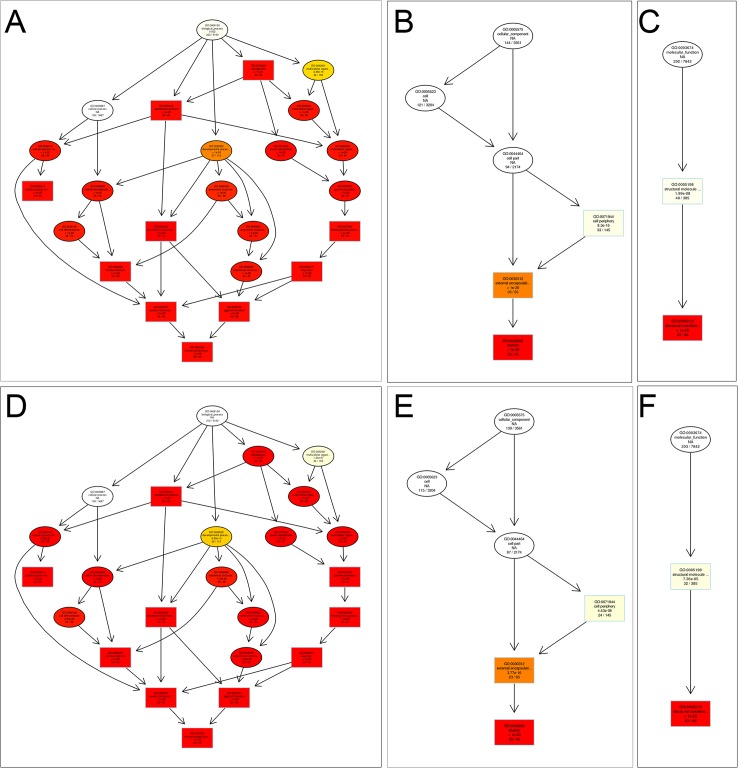
Fig 5. GO enrichment analysis for DEGs between two lines.
(A) Biological process for DEGs before thermal induction. (B) Cellular component for DEGs before thermal induction. (C) Molecular function for DEGs before thermal induction. (D) Biological process for DEGs after thermal induction. (E) Cellular component for DEGs after thermal induction. (F) Molecular function for DEGs after thermal induction. The sizes of the circles are proportional to the number of genes associated with the GO term. The arrows represent the relationship between parent-child terms. The color scale indicates the corrected P-value of the enrichment analysis.

