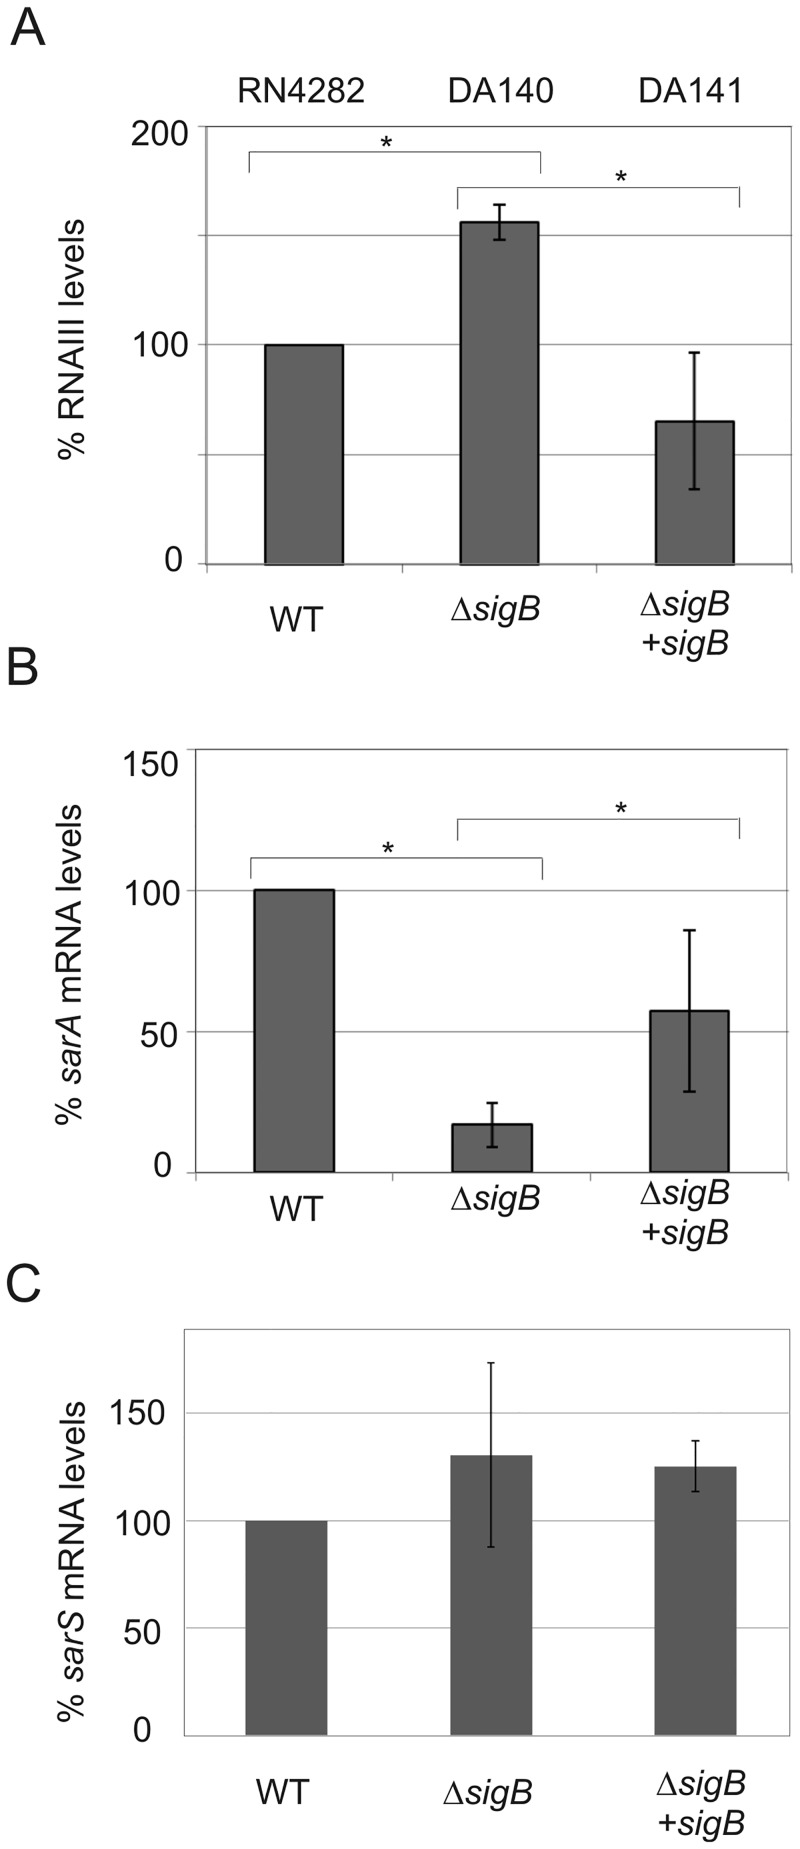
Fig 2. The effect of sigB disruption on RNAIII (A), sarA (B) and sarS (C) transcript levels in RN4282 and its derivatives using quantitative qRT-PCR measurements of RNA expression.
Relative changes are shown in each panel using RN4282 as 100%. Bars show +/- standard deviations and all data were compiled from three independent experiments. Statistical significance was evaluated by Student’s paired t test, and data were considered significant when P was <0.05.

