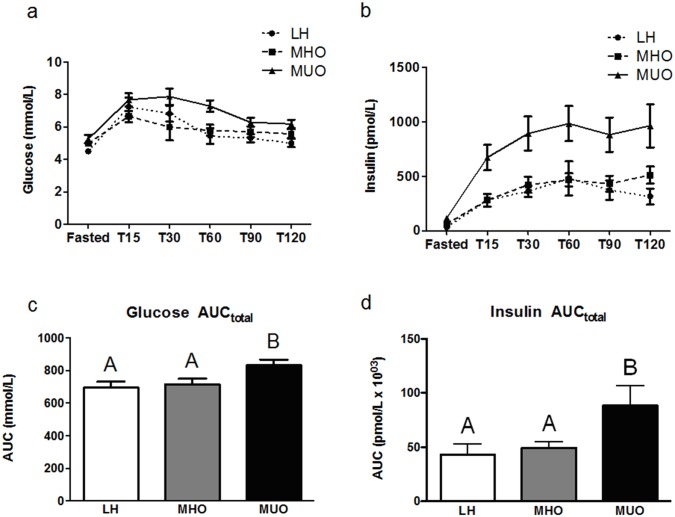
Fig 1.
Postprandial serum glucose (a) and insulin (b) responses (mean ± SEM) following consumption of the standardized meal in lean healthy (LH; circle, n = 10), metabolically healthy obese (MHO; square, n = 10), and metabolically unhealthy obese (MUO; triangle, n = 10) individuals. Glucose (c) and insulin (d) Area Under the Curve (AUCtotal), where white bars = LH; grey bars = MHO; and black bars = MUO. A non-parametric ANOVA Kruskal-Wallis test followed by a post-hoc Mann-Whitney test was used to determine differences between groups. Bars not sharing the same letter are statistically different (p < 0.05).

