
Fig 2. Analysis of gene expression measured by qRT-PCR under standard physiological conditions.
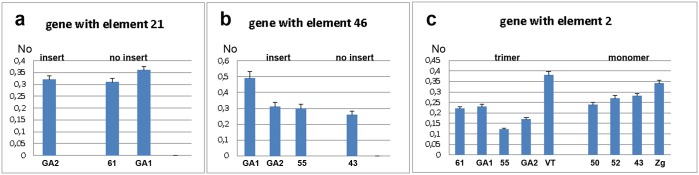
a) Expression of gene associated with element 21 in strains with (GA2) and without (61, GA1) element 21. b) Expression of gene associated with element 46 in strains with (GA2, GA1 and 55) and without (43) element 46. c) Expression of gene associated with TCAST1 element 2 in strains where element 2 is in the form of trimer and monomer. No represents normalized average No value for each gene. Columns show average of two different qRT-PCR experiments performed in triplicate and error bars represent standard deviations.