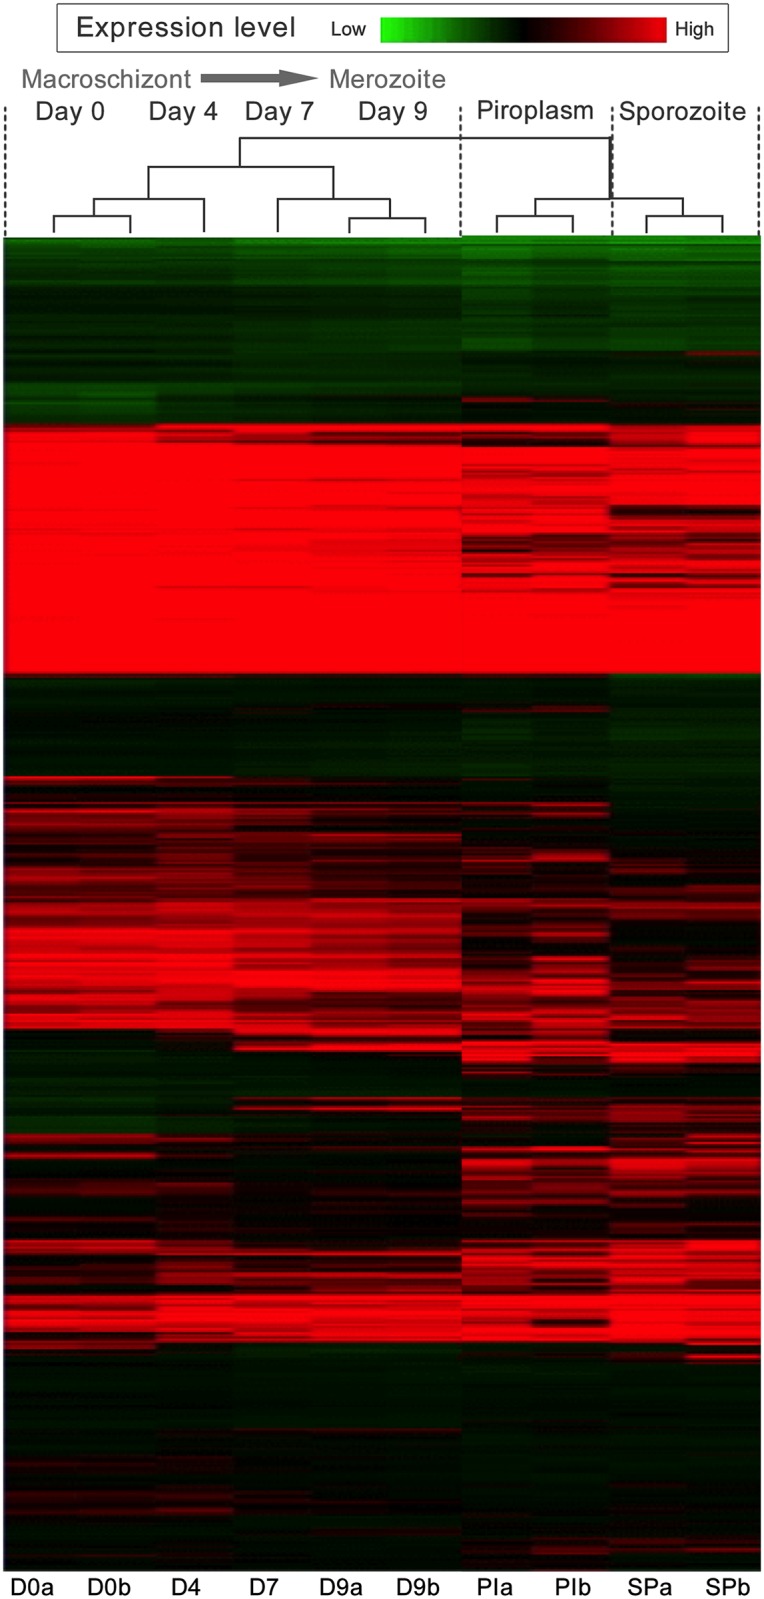
Fig 1. Life cycle stage and differentiation time course associated gene expression profiles in T. annulata identified by microarray analysis.

Heat-map and hierarchical clustering of T. annulata gene expression profiles of 3,792 predicted protein-encoding genes generated by microarray analysis of RNA derived from a stage-differentiation time-course: Day 0 (macroschizont), Day 4, Day 7 and Day 9 (merozoite production (merogony) occurred at Day 7 and Day 9 time-points); piroplasms (PI) isolated from erythrocytes and tick-derived sporozoites (SP). Each horizontal line represents an individual gene, replicate samples are labelled a and b. Green bands represent genes expressed at low levels, while black and red bands represent intermediate and highly expressed genes respectively.
