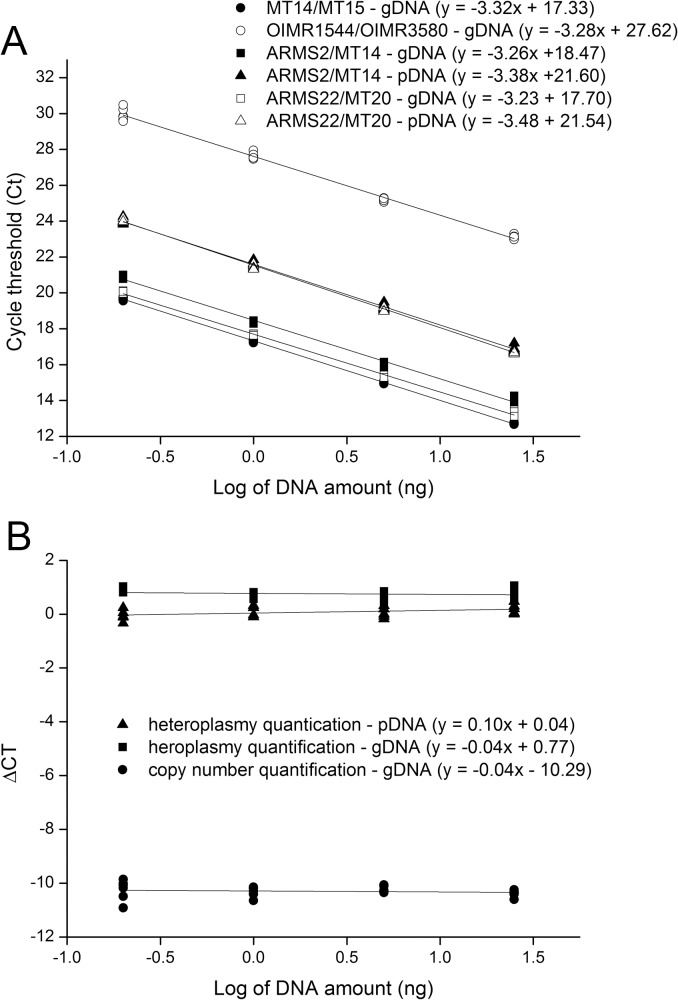
Fig 1. Analysis of primer efficiency.
Standard curves were generated by qPCR using as template 5-fold serial dilutions of heteroplasmic gDNA or pDNA (25, 5, 1 and 0.2 ng per reaction). First-degree linear regressions were fitted for the log of input amount of template versus the Ct (A) or the ∆Ct (B) values for serial-diluted DNAs. The ∆Ct was calculated by subtracting either CtB6 from CtNZB (heteroplasmy quantification) or CtmtDNA from CtApob (copy number quantification). Comparison of amplification efficiency between primer pairs (ARMS2/MT14 vs. ARMS22/MT20 and MT14/MT15 vs. OIMR1544/OIMR3580) was found similar as the slope values from linear regressions were equal or smaller than 0.1 (B). Moreover, the use of gDNA or pDNA for heteroplasmy quantification did not affect slope values.

