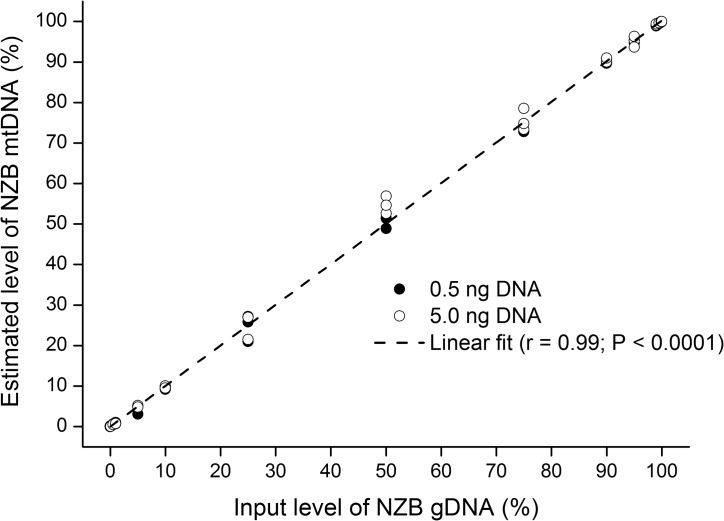
Fig 3. Relationship between the input level of NZB gDNA and the level of NZB mtDNA estimated by ARMS-qPCR.
Different proportions of gDNA from NZB mice (100%, 99.9%, 99.5%, 99%, 95%, 90%, 75%, 50%, 25%, 10%, 5%, 1%, 0.5%, 0.1% and 0%) were mixed with gDNA from B6 mice to be analyzed by ARMS-qPCR. Filled circles depict the use of 0.5 ng of DNA per reaction (duplicates) whereas empty circles depict the use of 5.0 ng of DNA (triplicates). The relationship between the input level of NZB gDNA and the level of NZB mtDNA determined by ARMS-qPCR was analyzed by calculating Pearson’s correlation coefficient (r). P value is denoted in the inset.

