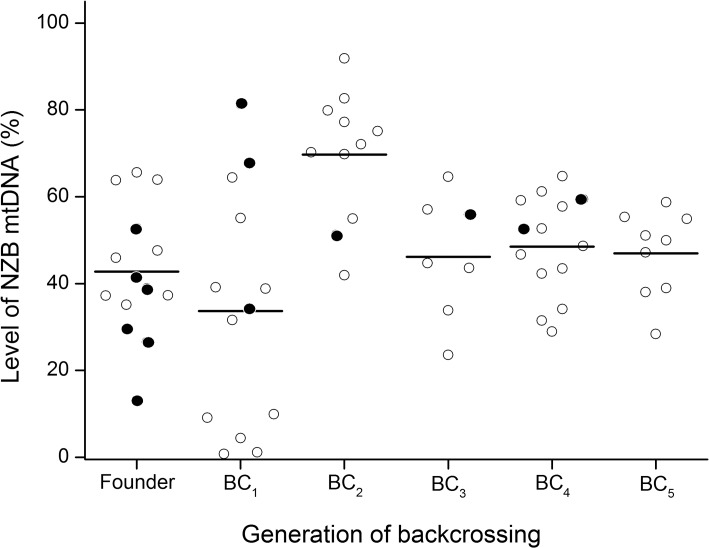
Fig 5. Level of NZB mtDNA across generations in a heteroplasmic mouse lineage produced by cytoplasmic transfer.
Circles depict the level of NZB mtDNA in mice estimated by ARMS-qPCR from ear biopsies. Filled circles depict females that were backcrossed (BC) with B6 males to obtain the next generation progeny (BC1, BC2, BC3, BC4 and BC5). The level of NZB mtDNA was not determined for males, except in the founder lineage where males are depicted by empty circles. In the remaining generations (BC1, BC2, BC3, BC4 and BC5) empty circles depict females that were not mated. Bars represent the means.

