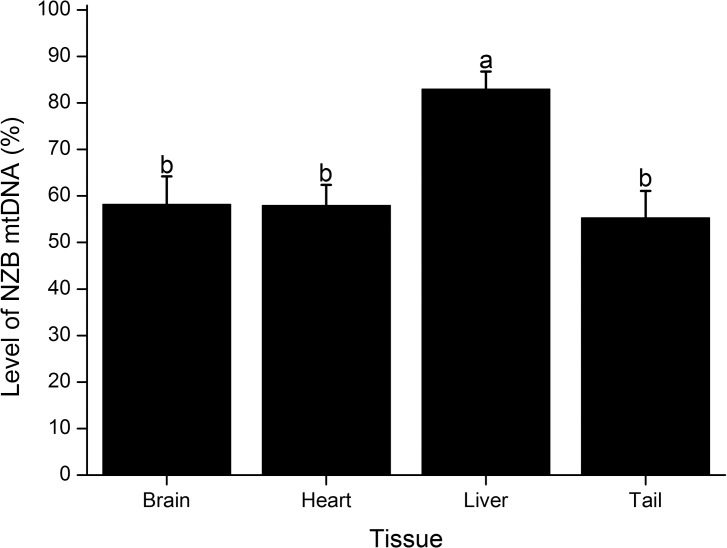
Fig 6. Comparison of the level of NZB mtDNA among tissues of heteroplasmic males.
Bars depict the level of NZB mtDNA estimated by ARMS-qPCR from mice aged four months. Tissues analyzed included brain, heart, liver and tail. Values are reported as mean ± SEM. Bars with different letters denote a significant difference among tissues (P < 0.05).

