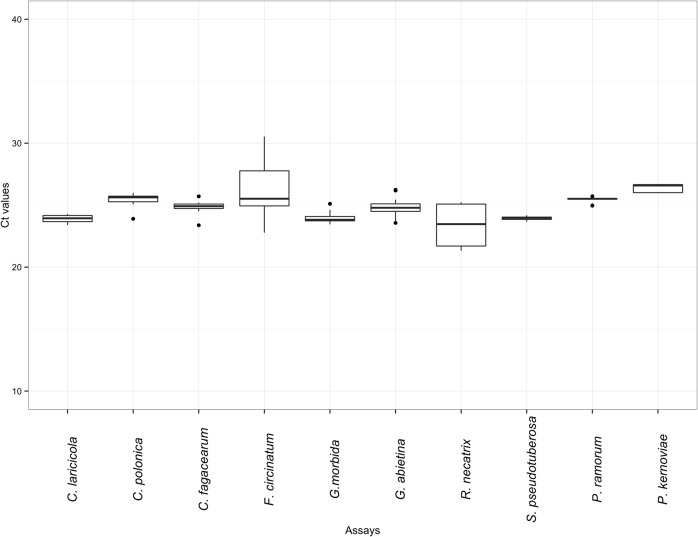
Fig 3. Precision of each of the 10 tree pathogen assays.
Box plot representing variation of the Ct value between technical replicates of various isolates from target species (mean Ct value ± coefficient of variation). DNA samples at a concentration of 5,000 copies of the target gene region were used.

