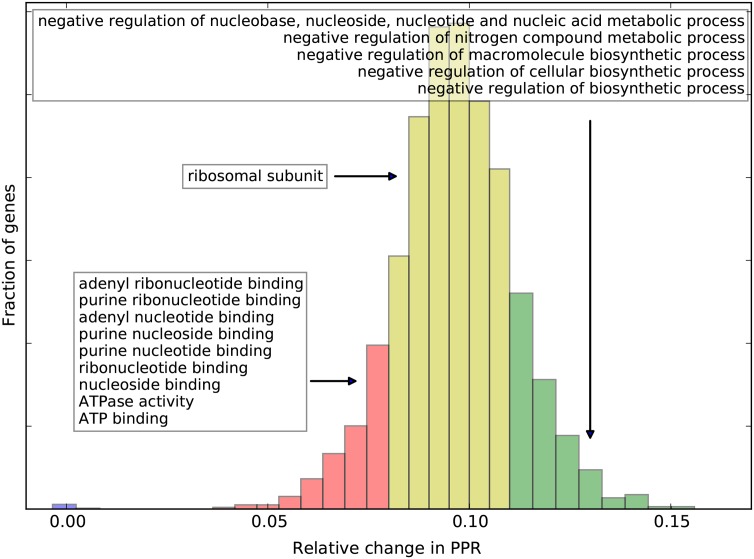
Fig 9. Distribution of the relative changes in PPR after a 10% increase in initiation rates shows that translation initiation is the rate limiting step for the protein production for most S. cerevisiae genes from the considered RP dataset.
Groups of genes with low (≥ 0.02 and < 0.08, red), medium (≥ 0.08 and < 0.11, yellow) and high (≥ 011, green) increase in PPRs are enriched for several biological functions (white boxes in the figure, FDR < 0.05).

