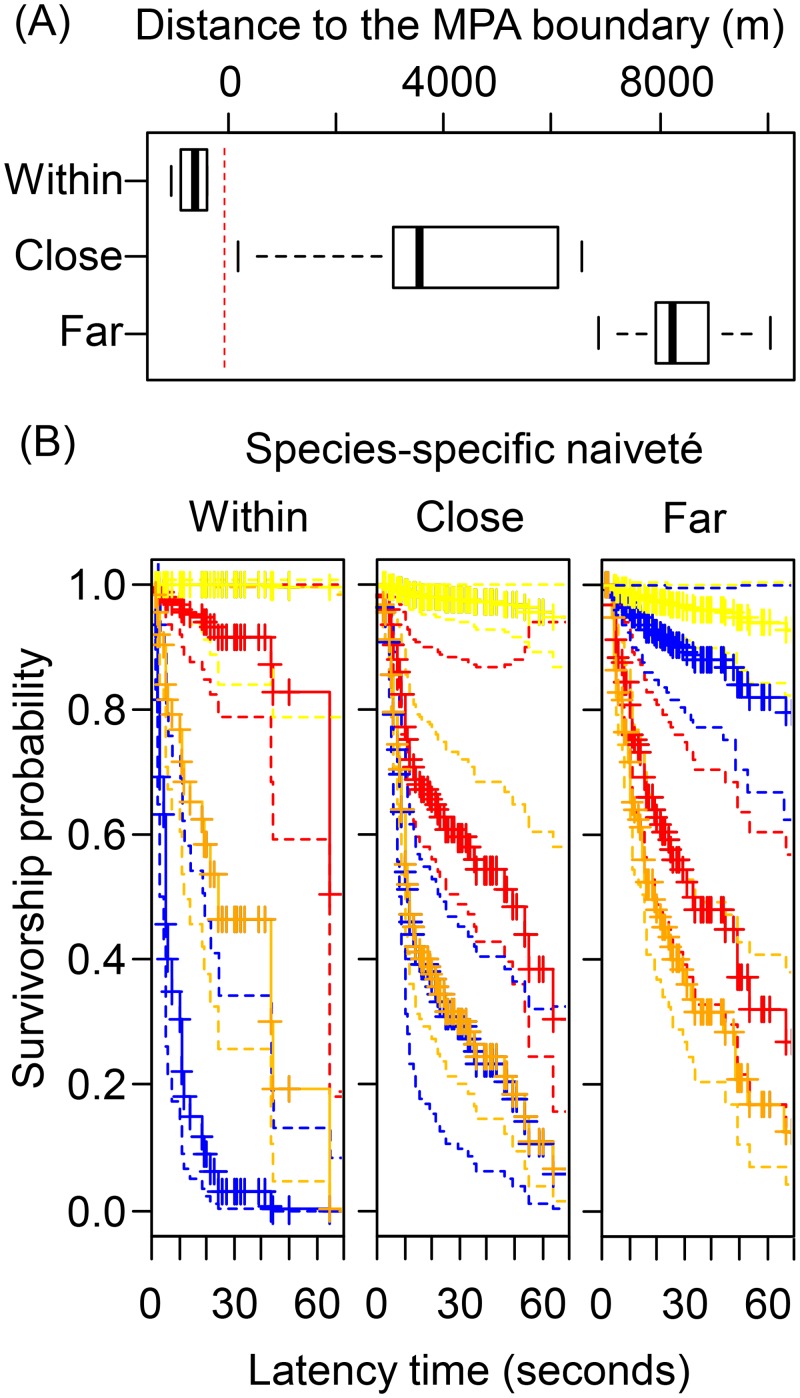
Fig 4. Predicted survivorship from the Cox regression.
The panel (A) shows a box-plot of the distribution of distances to the boundary for sampling points within (up), close (mid) and far (lower) to the MPA. The vertical red dashed line indicates the boundary of the MPA. The panel (B) shows the predicted survivorship probability (y-axes) as a function of latency time (LT) (x-axes, in seconds) for the four species considered: C. julis (orange), D. annularis (red), C. chromis (yellow) and S. scriba (blue). The lower-left, lower-mid and the lower-right panels correspond to sampling point locations within, close and far to the MPA, respectively,. Solid lines indicate the expected survivorship probability and dashed lines the 5% confidence intervals. Note that S. scriba shows different survivorship (~naïveté) pattern depending on the distance to the boundary of the marine protected area (MPA).

