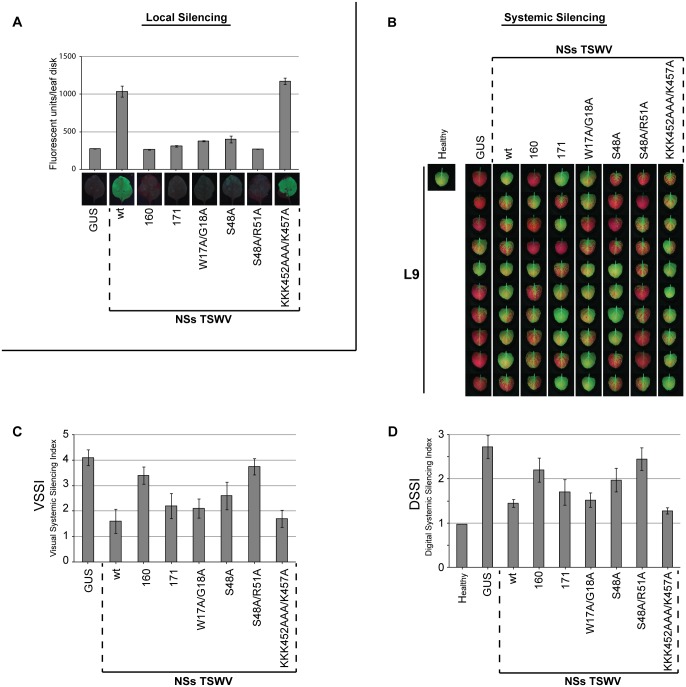
Fig 5. Systemic GFP silencing at 17 days after agroinfiltration with pBinGFP and various NSs mutants/variants.
N. benthamiana 16C plants were infiltrated at leaf L4 with pBinGFP in the additional presence of NSs gene constructs from TSWV isolates 160 or 171, or from NSsTSWV mutants W17A/G18A, S48A, S48A/R51A, KKK452AAA/K457A. As a negative control leaves were infiltrated with pBinGUS. As a positive control NSs from TSWV BR01 (indicated as “wt”) was used. (A) Fluorescence images (bottom) on local GFP silencing suppression in N. benthamiana leaves by the NSs mutant/variant gene constructs indicated. Graph shows the number of fluorescence units [28] measured in leaf disks (1 cm2) collected from the agroinfiltrated leaf areas. Error bars indicate standard error of mean (SEM) of three replicates. (B) Fluorescence images of systemic GFP silencing in leaves L9 from ten 16C plants in the presence of NSs muntat/variant gene constructs indicated. (C) Visual Systemic Silencing Index (VSSI) of systemic GFP silencing in leaves shown in panel B. (D) Digital Systemic Silencing Index (DSSI) of systemic GFP silencing in leaves shown in panel B. Error bars indicate the standard error of the mean (SEM) of measures resulting from 10 leaves.

