
Fig. 3.
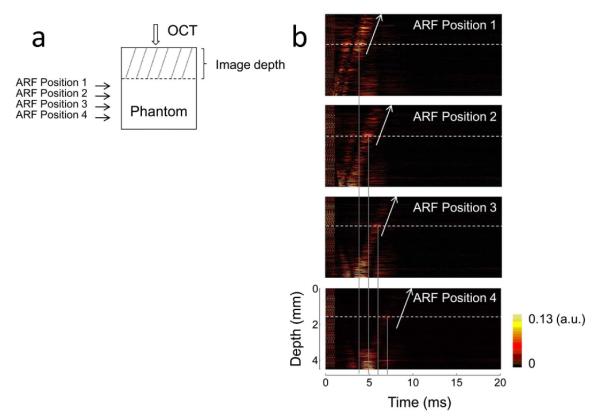
Shear wave measurement with different ARF focus positions. (a) A schematic of the ARF excitation positions and OCT detection position. The position of OCT detection beam and the phantom are fixed. The ultrasonic transducer is moved downward at a step of 1 mm using a mechanical Z stage. (b) IBDV images with different ARF focus positions. Dashed lines indicate the same depth of the phantom and solid lines indicate the time of vibration at this depth. The vibrations at same depth are delayed when the transducer is moved downward. The propagation velocity of the shear wave around the ARF focus located at the deeper phantom can be calculated using the change of ARF position and the delay of detected vibration time.