
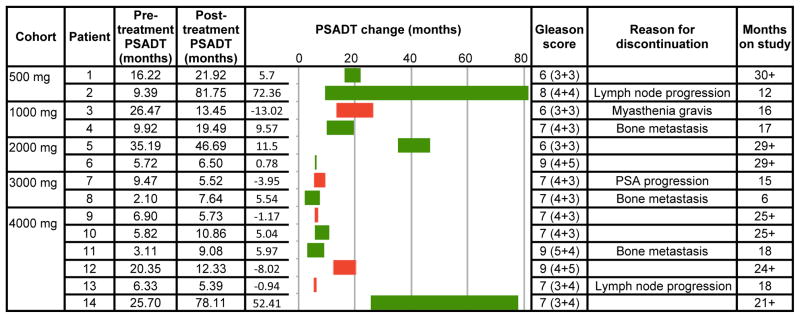
Table 3.
Pre- and Post-treatment PSADT, Gleason Scores and Reasons for Discontinuation
|
The graphic element of this table displays changes in PSADT. The green bars show lengthening of PSADT from pre-treatment (left end) to post-treatment PSADT (right end). The red bars show shortening of PSADT from pre-treatment (right end) to post-treatment (left end).