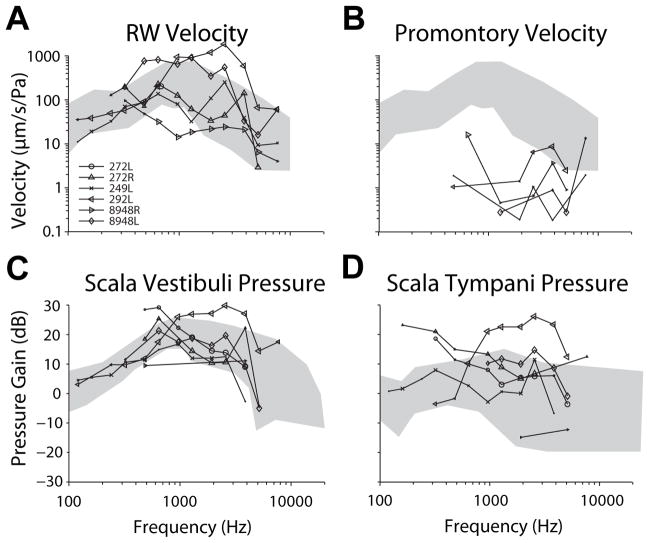
Figure 1.
Transfer functions of measures ( ) to closed-field acoustic stimulation between 120 to 10240 Hz in each specimen. and magnitudes (Fig. 1A–B) are shown superimposed on the range of RW velocities shown in two prior reports [15–16] for comparison. Likewise, (Fig. 1C–D) are shown superimposed on the range of responses reported previously [10]. Responses are shown for signal-to-noise ratios greater than 3 dB, and marker size indicates signal strength (small > 3 dB, medium > 6 dB, large > 9 dB).

