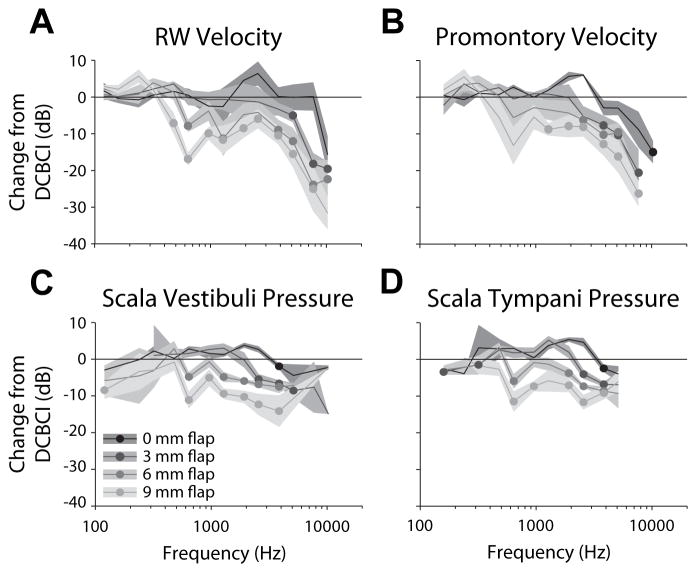
Figure 6.
The mean (±SEM) differences in magnitude between each of the TCBCI and the DCBCI (expressed in dB re: DCBCI magnitude) conditions as a function of frequency, across the population of specimens. Frequencies at which the mean TCBCI response was significantly lower (via a 1-tailed Student’s t-test) than the DCBCI response (i.e. the mean difference is different than zero) are indicated with filled circles. All t-test results shown have at least two degree of freedom and p < 0.05.

