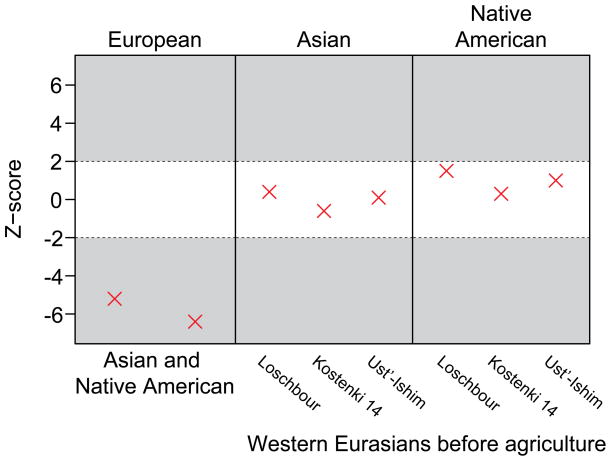
Figure 1. Allele sharing between the Oase 1 individual and other genomes.
Each point indicates the extent to which the Oase 1 genome shares alleles with one or the other of a pair of genomes from different populations indicated above and below (see Extended Data Table 1 for numbers). Z-scores larger and smaller than |2| indicate an excess of allele sharing (grey).

