
Figure 1.
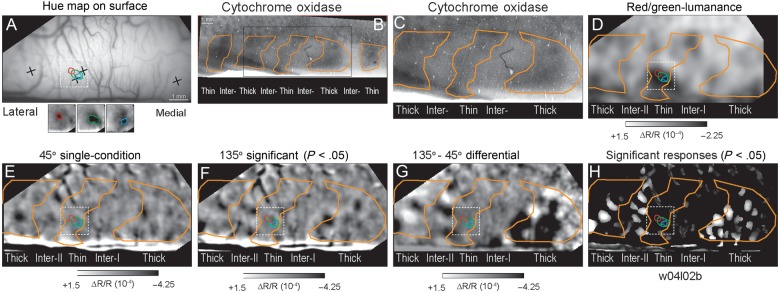
Statistically significant responses aligned to CO stripes. (A) Cortical surface vasculature used to align functional images to histological tissue. Crosses indicate the positions of neuroanatomical tracer injections subsequently recovered in tissue sections. Red, green, and blue contours within the black square indicate the cortical positions of significant isoluminant single hue responses indicated in the functional image inserts below and superimposed on panels D–H. (B) Low magnification view of CO pattern in this hemisphere. The black rectangle indicates the region corresponding to the imaged portion of this case. (C) CO section corresponding to the imaged portion of the hemisphere. Orange contours indicate borders of CO-dense stripes. (D) Differential image comparing responses to isoluminant red/green grating and luminance-contrast grating. The single-condition hue responses align with the color-preferring (dark pixels) of the thin stripe. (E) Single-condition (ΔR/R) image resulting from stimulation with a moving 45° luminance-contrast grating moved in both directions. (F) Single-condition (ΔR/R) image resulting from stimulation with a moving 135° luminance-contrast grating moved in both directions. (G) Differential image indicating the activation pattern in response to 135–45° gratings. (H) Sum of the statistically significant single-condition activations in response to 45 and 135° gratings. (Case 1; w04l02b).