Figure 4.
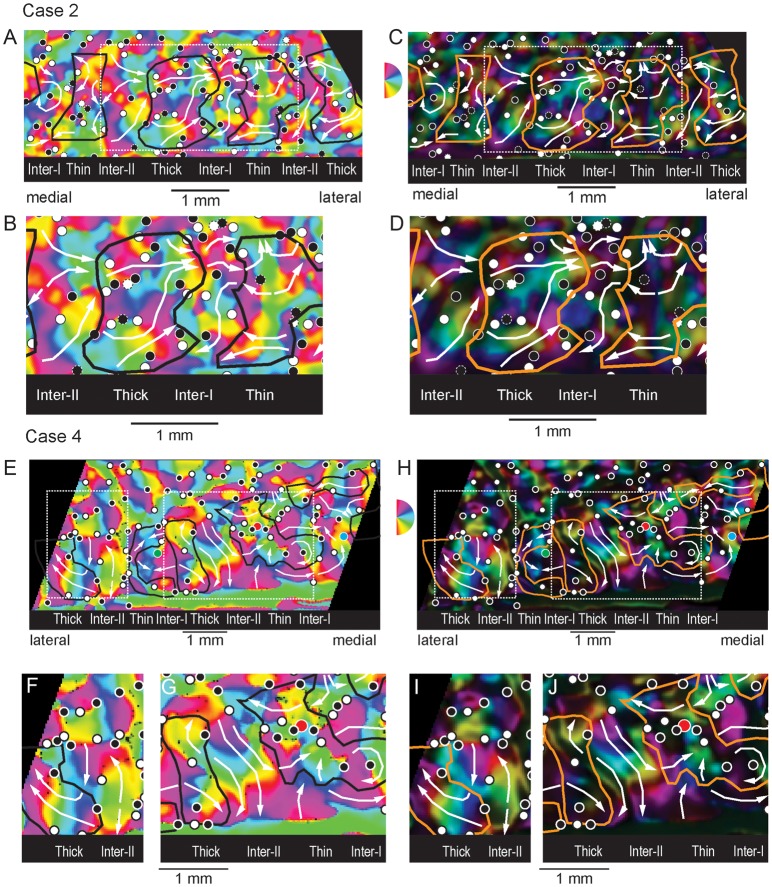
Organization of orientation preferred angle and selectivity. (A) Orientation preferred angle map in which the angle of the summed orientation vector is color-coded for each significantly modulated (P < 0.05) pixel. The black contours indicate the borders of the dense CO stripes (see Fig. 2). The small circles indicate the positions of clockwise (white) and counterclockwise (black) orientation pinwheel centers. White arrows indicate large-scale orientation sequences within each CO stripe compartment. (B) Enlargement of the region bounded by the dashed white rectangle in the map of preferred angle in panel A. (C) Orientation selectivity map in which the brightness of each color-coded preferred angle indicates the degree of orientation selectivity (orientation vector magnitude). Bright pixels exhibit high orientation selectivity whereas dark pixels are poorly selective for orientation. (D) Enlargement of the central portion of the preferred angle map in panel C enclosed by the dashed white rectangle. Case 2 (s06). (E) Orientation preferred angle map illustrating the orientation pinwheels and larger scale orientation sequences across the CO stripe pattern (black contours) in Case 4 (m32). (F) Enlargement of the lateral dashed white rectangle in panel E highlighting the organization of preferred angle in the thick stripe and adjacent type-II interstripe. (G) Enlargement of the medial dashed white rectangle from panel E highlighting the orientation sequences within the central thick stripe and adjacent type-II interstripe. (H) Corresponding orientation selectivity map from Case 4 illustrating locations of orientation pinwheel centers and large-scale orientation sequences relative to CO stripe borders (orange contours). (I) Enlargement of the lateral dashed white rectangle from panel H. (J) Enlargement of the medial dashed white rectangle in panel H.

